Analytics Strategy
MECE: The McKinsey Principle That Should Guide Every Metrics Framework You Build
Most startups accumulate metrics over time. The best ones design them.
A startup ships a redesigned onboarding flow. NPS jumps 15 points. The product team celebrates in Slack. A week later, someone pulls a retention report. Day 30 retention is down 8%. Engineering checks the monitoring dashboard — page load time has quietly doubled since the release.
The team is confused. Users said they loved it. How can retention be falling?
The answer: the team was watching one metric in a vacuum. NPS improved. But the portfolio of metrics they were watching wasn't designed to catch the full picture. They had a happiness signal but no performance signal, an engagement signal but no long-term retention signal. A comprehensive set of metrics would have surfaced the warning before three months of users had churned.
This is the problem MECE was designed to solve.
What MECE Is
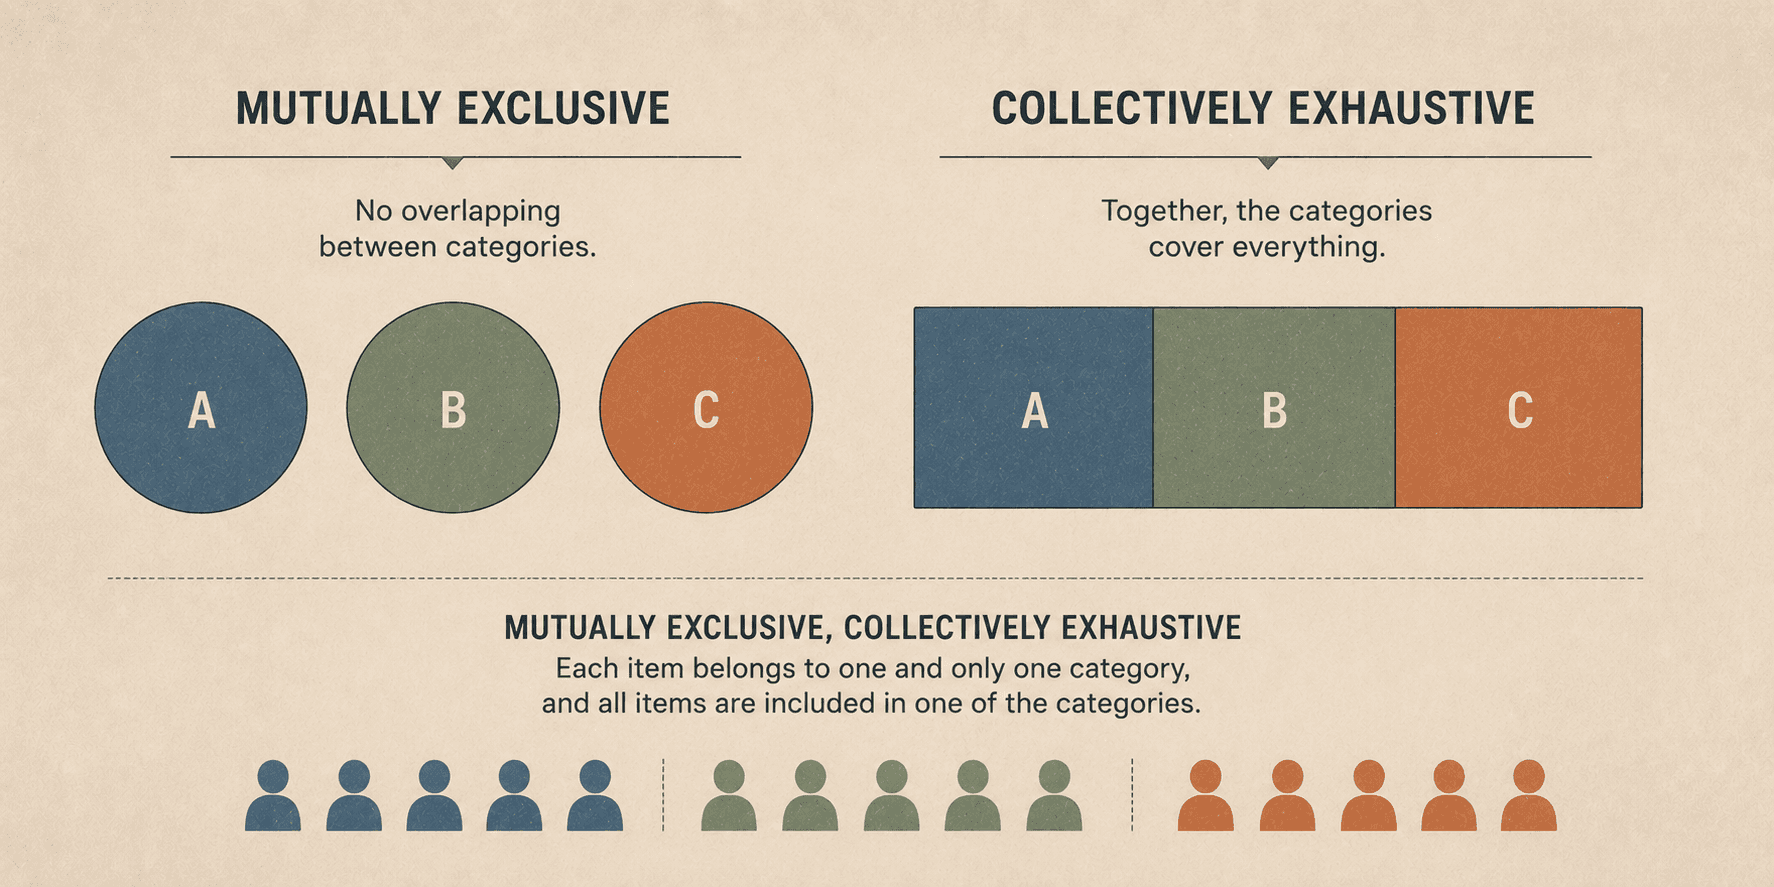
MECE stands for Mutually Exclusive, Collectively Exhaustive. It was developed by McKinsey consultants as a framework for breaking complex problems into logical subgroups — subgroups that don't overlap with each other and that together cover everything that matters.
Originally a strategy consulting tool for problem decomposition, it applies with equal force to metrics design. When your metrics portfolio is MECE, two things are true:
Mutually Exclusive: no two metrics in your portfolio are measuring the same thing from the same angle. There's no redundancy, no false sense of coverage from having the same signal reported twice.
Collectively Exhaustive: every important dimension of your product and business performance is covered by at least one metric. There are no blind spots.
When metrics are MECE, the portfolio functions as a system of checks and balances. When they're not, the portfolio functions as a highlight reel — it confirms what you already believe and misses the things you didn't think to look for.
Why Mutual Exclusivity Matters: Avoiding False Coverage
Redundant metrics create the illusion of rigor without the substance. If you're tracking both "DAU" and "daily sessions" without distinguishing between them — if both are measuring roughly the same user activity from the same data source — you have two numbers where you need one. They'll move together, they'll confirm each other, and they'll give you confidence that you're covered when you're actually just hearing the same signal twice.
The test for mutual exclusivity is simple: can this metric answer a question that no other metric in my portfolio can answer? If the answer is no — if removing this metric wouldn't create a blind spot, because another metric already covers the same ground — then it doesn't belong in the portfolio.
The more common failure, in practice, is the opposite: organizations that have accumulated twenty or thirty metrics over time, with significant overlap, mistaking volume for coverage. Pruning to the minimum set that actually provides distinct information is more valuable than adding more metrics, in most cases.
Why Collective Exhaustiveness Matters: Avoiding Blind Spots
Collective exhaustiveness is where the opening scenario plays out. The startup that only watched NPS wasn't tracking a vanity metric — NPS is a legitimate signal. They were watching an incomplete portfolio that didn't include counterbalancing metrics for performance and long-term engagement.
Here's a second scenario that illustrates the same problem differently.
Your growth team runs an experiment on the home screen. DAU/MAU goes up significantly. The experiment appears to be working. But when you look at the retention curve for users who were exposed to the test variant, retention at Day 30 is meaningfully lower than for the control group.
If you only watched DAU/MAU, you ship the feature. If you're watching retention alongside engagement, you see the trade-off: the change is creating short-term activity spikes without building lasting habits. Maybe the change is still worth shipping — but that's a conscious decision, made with full information.
Collective exhaustiveness means that your portfolio, as a whole, doesn't let you make that decision in ignorance. Every important dimension of performance is covered by at least one metric. The gaps that allowed the startup in the opening scenario to celebrate while churning users simply don't exist.
Applying MECE to Your Metrics Portfolio: A Four-Step Process
Step 1: Map Your Metrics to the HEART Framework
HEART is Google's framework for product metrics, and it provides an excellent starting structure for ensuring collective exhaustiveness. It stands for:
Happiness — how users feel about the product (NPS, CSAT, usability scores)
Engagement — how often and how deeply users use the product (DAU/MAU, session depth, meaningful events per user)
Adoption — how users enter the product and grow into it (registrations, feature uptake, activation rate, CPA)
Retention — whether users return over time (Time Since and Time Over Time retention curves)
Task Success — whether users can accomplish what they came to do (success rate, task time)
Map every metric you currently track to one of these five categories. Then ask: is every category represented? If you have no Happiness metric, you have no attitudinal signal — you can see what users do but not how they feel about it. If you have no Task Success metric, you have no measure of product effectiveness at the task level.
Coverage gaps in the HEART framework are structural blind spots. Fill them before you discover them the hard way.
Step 2: Check for Mutual Exclusivity
With your current metrics mapped to HEART, look for overlap within categories.
Are you tracking DAU and daily active sessions from the same users? You can probably consolidate. Are you tracking two different retention metrics that both measure the same user behavior? Determine which is more informative for your primary use cases and remove the other.
The goal: each metric should answer a question that would go unanswered if it were removed.
Step 3: Check for Collective Exhaustiveness
Now look for gaps across categories.
Are there important business questions that no metric in your current portfolio answers? Common gaps in startup metrics portfolios include: cost-side metrics (CAC, gross margin, LTV/CAC), qualitative signals (NPS is often the first metric cut when teams feel overwhelmed), and task-level performance metrics (success rate and load time are frequently absent).
A useful exercise: write down the ten most important questions you'd want to answer about your product's health in a given week. Then check each question against your metrics portfolio. If a question doesn't have an answer, that's a gap.
Step 4: Apply the Check-and-Balance Test
For every success metric you track, identify the counterbalancing metric that would catch unintended negative effects.
Pageviews per session: counterbalanced by session quality or task completion rate (prevents optimizing for meaningless clicks)
DAU/MAU: counterbalanced by Day 30 retention (prevents short-term engagement spikes masking long-term churn)
NPS: counterbalanced by behavioral retention and load time (prevents shipping features that feel good but perform badly)
Revenue growth: counterbalanced by churn rate and margin (prevents top-line growth that masks a deteriorating unit economics story)
If a success metric doesn't have a counterbalancing metric, it's a single point of failure in your decision-making system. Someone optimizing against it in isolation will be flying blind.
MECE Beyond Metrics
The principle extends naturally to the adjacent analytical challenges every growing organization faces.
User segmentation: user segments should be MECE. Every user belongs to exactly one segment in a given segmentation scheme. Overlapping segments (users appearing in multiple groups) create analysis problems; exhaustion gaps (users not belonging to any group) create analytical blind spots. When you design a behavioral segmentation, apply the MECE check before building campaigns or conducting analysis against it.
OKRs: company-level Objectives should collectively cover all strategic priorities without duplication across departments. If two departments both have OKRs around "improving retention," the question is whether they're measuring different dimensions of retention or just competing for the same outcome. The former is fine; the latter creates confusion and duplicated effort.
Reporting: reports should cover the business comprehensively without producing the same view five different ways. A metrics review that includes five slightly different slices of the same retention metric gives stakeholders the impression of depth without the reality. One well-designed retention metric, fully contextualized, is more valuable.
Comprehensive vs. Having a Lot
There's an important distinction here that's easy to miss.
A comprehensive metrics portfolio is not a large one. In fact, a large portfolio of poorly designed metrics is almost always less useful than a small one designed on MECE principles.
The goal is the minimum number of metrics that provides a complete, non-redundant view of your product's and business's health. Einstein's principle applies: everything should be made as simple as possible, but not simpler. The same is true of metrics: as few as possible, but not fewer.
When you design from MECE first principles rather than accumulating metrics over time, you end up with something that feels counterintuitively small — maybe 12 to 20 core metrics, well-defined, consistently calculated, with clear owners and documented counterbalancers. That set is more powerful than a dashboard with 60 metrics because it doesn't require anyone to mentally parse which numbers actually matter.
Build a Portfolio, Not a Pile
Most startups accumulate their metrics organically. An analyst adds something to the dashboard when a question comes up. A product manager requests a new chart after a board meeting. The CEO asks for a metric they saw in a competitor's earnings call. Over time, the portfolio grows — but it was never designed.
The MECE principle is the antidote to accumulation. It forces the structural question: what do I need to cover, and do I have exactly what I need — no more, no less?
Applied rigorously, it produces a metrics portfolio that surfaces problems early, validates wins accurately, and gives every team a clear, unambiguous view of what success looks like. Not a highlight reel. A system of checks and balances.
That's the difference between metrics that make you feel informed and metrics that actually keep you honest.
The MECE metrics framework, the HEART methodology, and the complete metrics design curriculum are covered in The Data Strategist course.