Case Studies
What It Takes to Build a Data Experience 200 Million People Actually Want to See
Spotify just dropped something special for their 20th anniversary — a personalized recap that reminded me exactly why I fell in love with this kind of work.
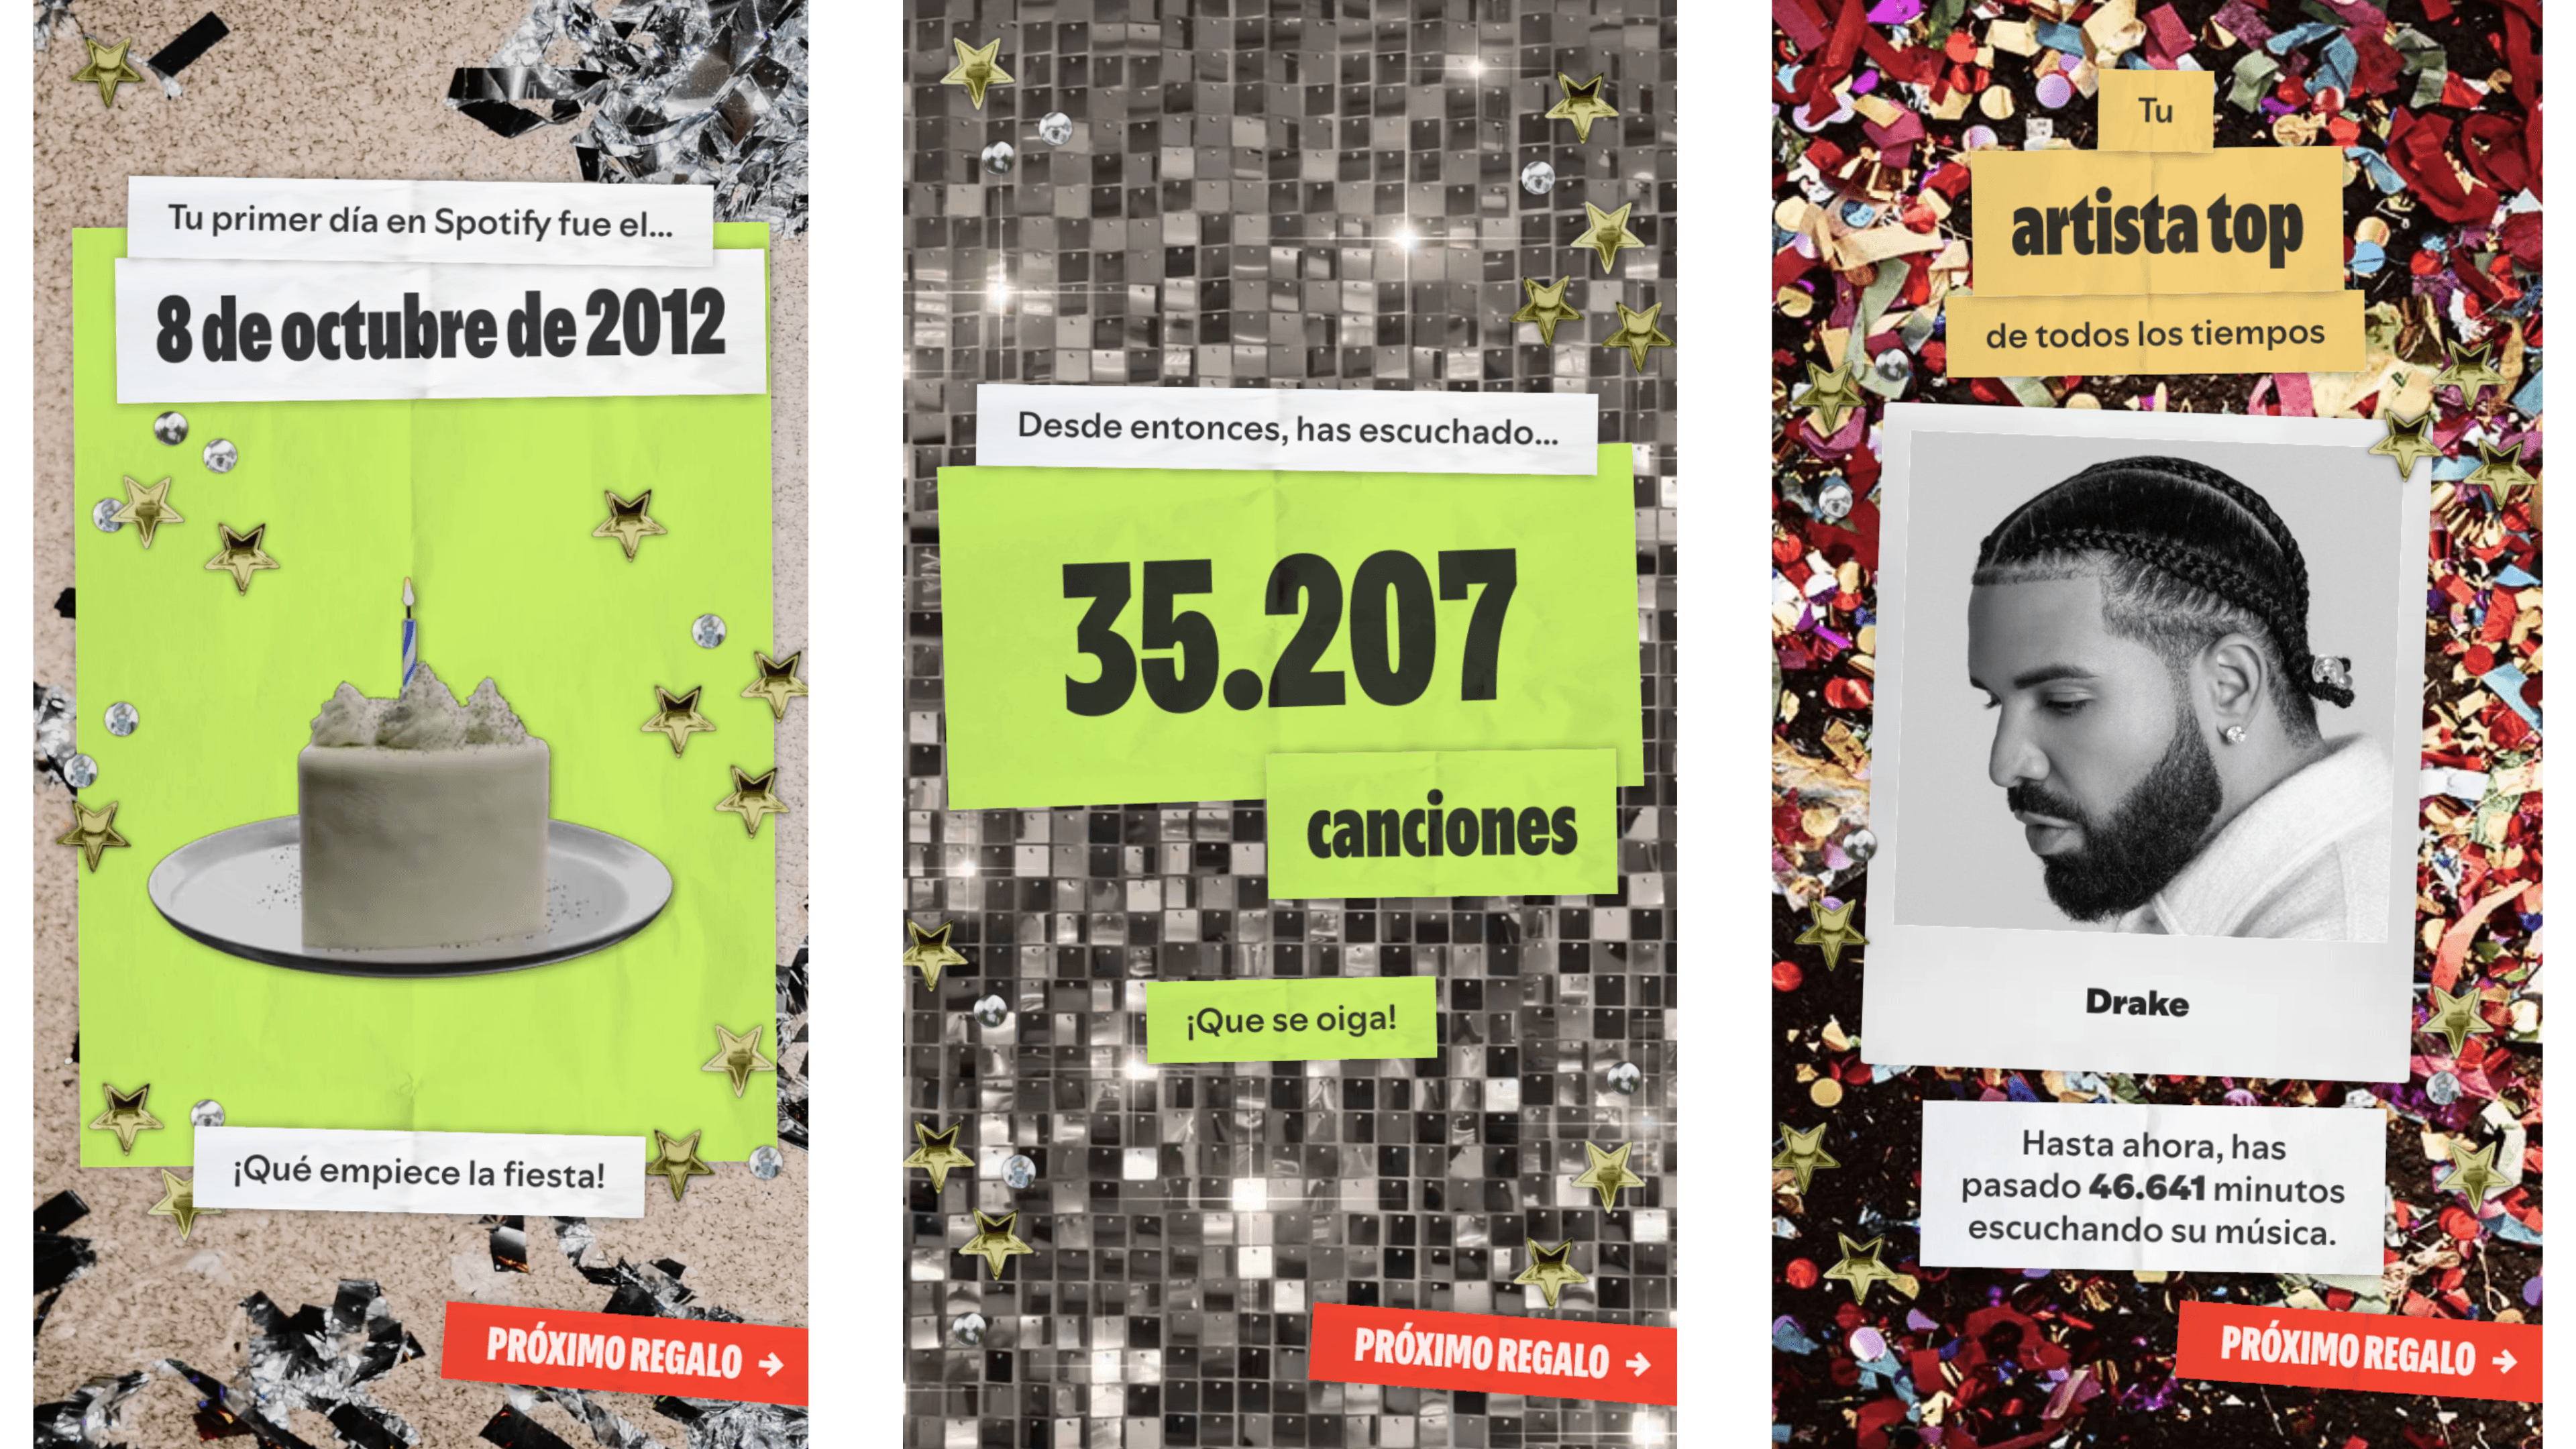
If you haven't seen it yet, Spotify's anniversary experience surfaces your listening history across the full arc of the platform's existence: the songs that defined your summers, the artists you discovered before anyone else, the playlists that got you through. It's nostalgic, it's personal, and it's deeply shareable. People aren't posting screenshots of their bank statements or their email inboxes — they're posting this.
That reaction isn't an accident. It's the product of intentional decisions at every layer of the data stack. And I know this firsthand.
My Experience Building the 2017 Spotify Year in Review
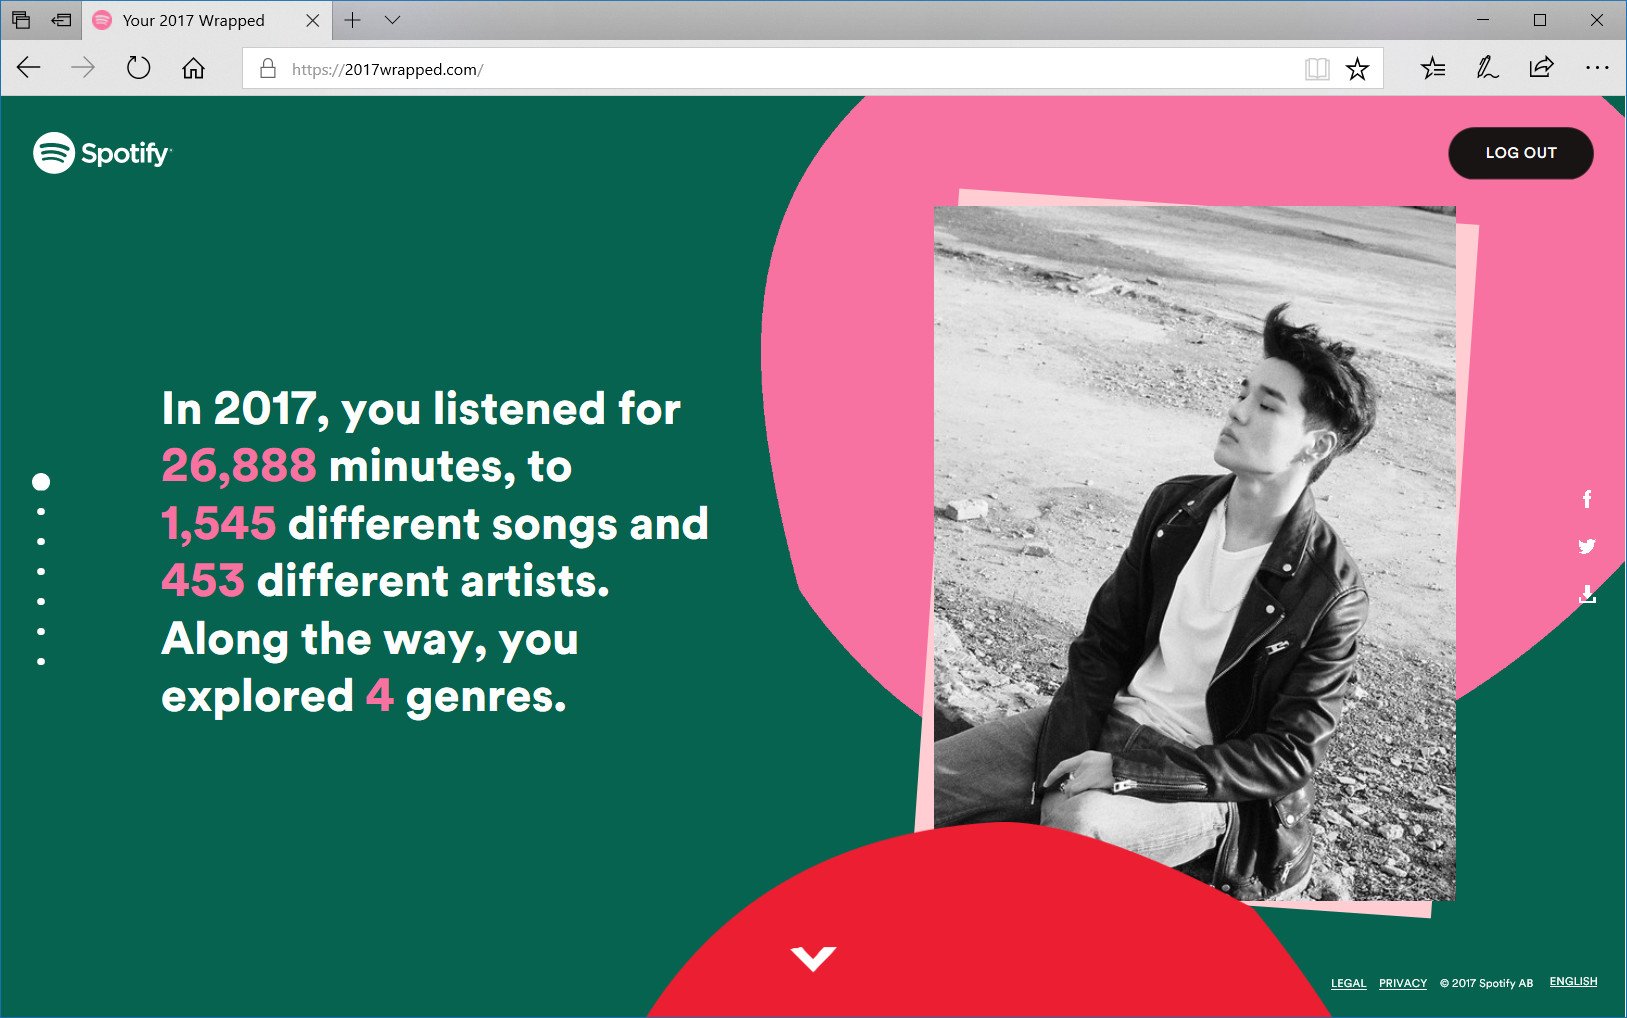
Back in 2017, I spearheaded the data efforts for Spotify's Year in Review campaign — one of the largest personalized data experiences Spotify had run at the time. The campaign spanned 30 countries and was ultimately viewed by more than 200 million users.
What made it complex wasn't the scale alone — it was the breadth. The campaign included an in-app personalized experience, market-specific out-of-home marketing content (think billboards timed to cultural moments in each country), top streaming charts across every Spotify market, and personalized playlists for Premium users. Each element had to be both globally coherent and locally meaningful.
That work taught me more about the intersection of data, creativity, and human behavior than almost anything else in my career.
More recently, I built a similar experience for 1of10.com — a data product that decoded what actually drives virality in YouTube videos. The insights resonated deeply with creators and data enthusiasts alike, generating 215,000 views on X/Twitter. The lesson carried over: when data tells a story people recognize in their own lives, they share it.
Why Recap Experiences Work
Before getting into the how, it's worth understanding the why.
Recap experiences work because they do something most analytics dashboards never do: they make the user the protagonist. Instead of showing aggregate trends, they show you — your habits, your taste, your quirks. The data becomes a mirror, and mirrors are compelling.
They also unlock social sharing as a natural byproduct. When someone discovers they were in the top 0.01% of Lil Wayne listeners, they don't keep that to themselves (at least I didn’t). That's not a metric — that's an identity. And identities get shared.
Six Lessons for Building Your Own Masterful Recap Experience
Whether you're leading data at a streaming platform, a fintech app, an e-commerce company, or a fitness brand, the playbook translates. Here's what I've learned.
1. Start with a Strong Data Foundation — Well Before You Need It
The single biggest mistake teams make is waiting too long to think about data. Recap campaigns require historical, longitudinal data, and that data needs to be clean, structured, and accessible before the sprint to build the experience begins.
Instrumenting, transforming, or backfilling data under deadline pressure is one of the most painful things a data team can endure — and the quality always suffers. If you're thinking about launching a recap experience six months from now, start auditing your data infrastructure today. What events are you capturing? What's missing? What would you wish you had? Build those pipelines now.
2. Involve Creative and Marketing Teams Early
Data people and creative people often speak different languages, and recap campaigns live at their intersection. The best outcomes I've seen come from getting these teams in a room together at the very start — not as a handoff at the end.
Creative teams have an intuitive sense for what resonates emotionally. Data teams know what's possible technically. The magic is in the overlap. Use shared frameworks — mood boards, user stories, narrative arcs — to bridge those worlds. When a designer says "I want users to feel like they've been seen," your job as a data practitioner is to translate that into a measurable, deliverable signal.
3. Think About the Human Experience, Not Just the Metrics
This one is easy to miss. When you have access to rich first-party data, the temptation is to surface the biggest numbers: total spend, total listening time, total sessions. But those numbers rarely connect emotionally.
People don't relate to aggregate volume. They relate to moments. The song that came on during a road trip. The genre they secretly binge every Sunday morning. The artist they've been loyal to for a decade.
The dimensions and metrics that make great recap experiences tend to be behavioral and contextual — time of day, day of week, streaks, surprising transitions, and above all, specificity. Less "you listened a lot" and more "you listened to this song 47 times in October."
4. Tie Data Back to Experiential Marketing
The most memorable moments from Spotify's personalized experiences have always been the ones that crossed the digital-physical divide. Spotify once sent me a message from Bad Bunny because I was one of his top listeners. Another time, they sent me a concert notification — with a personal message — from Young Miko, because I was a top listener and she was performing in CDMX while I was living there.
Those moments felt like magic. They weren't automated blasts — they felt curated, even intimate. That's the power of combining first-party behavioral data with real-world context. Think about how your product's data can unlock personalized experiences that extend beyond the screen: targeted OOH, event-triggered CRM, location-aware notifications. The brands that get this right earn a loyalty that's hard to buy.
5. Use Statistics That Pop
How you present data is just as important as what data you present. A few techniques that consistently land:
Percentiles and top-N framing. "You were in the top 0.01% of Lil Wayne listeners globally" is infinitely more compelling than "you listened to Lil Wayne 312 times." Percentiles create context and, crucially, create identity.
Collaborative filtering and k-NN. Find users who look like your user and surface what they love. This isn't just a recommendation engine trick — it's a storytelling device. "People who listen like you also loved…" is a compelling sentence.
Normalize against the average. Don't tell someone they listened to Drake or Taylor Swift unless they listened to them significantly more than the average user. Surfacing commonality isn't interesting. Surfacing outliers is.
Real-life segmentations. Don't just report on a user's overall behavior — slice it meaningfully. "Your morning listening," "your Friday hype playlist," "your late-night wind-down habits." These map to lived experience in a way raw numbers never can.
6. Use Data as a Discovery Tool
Perhaps the most underutilized opportunity in recap experiences is the chance to show users something about themselves they didn't know.
Using collaborative filtering, you can surface unknown-unknowns — artists they haven't heard yet but statistically should love, categories they've never explored but are adjacent to their current obsessions, moments in their history they'd forgotten. When a product shows you something true about yourself that you hadn't articulated, the effect is almost uncanny. That's the experience people tell their friends about.
Discovery features consistently outperform pure retrospective features in sharing and engagement. Don't just show people where they've been — show them where they might go.
The Opportunity in Front of Every Consumer Business
The companies that will win the next decade of consumer loyalty aren't necessarily the ones with the best product features. They're the ones that make their users feel known.
Every consumer business sitting on first-party data — whether it's a retailer, a health app, a neobank, a streaming service, or a travel platform — has the raw material for this kind of experience. The question is whether you're using it to build dashboards for your internal team, or stories for your users.
Spotify's 20th anniversary recap is a reminder that the latter is one of the most powerful things you can do with data. I've seen it work at global scale. I've seen it work in a scrappy single-product context. The principles hold.
Start building your data foundation now. Bring your creative teams along for the ride. And when the moment comes, make your users the hero of the story.
Have you built or experienced a memorable data recap? I'd love to hear what made it land — or what fell flat. Drop a comment below.