"The Most Python" Report
Analyzing 200K Jupyter notebooks and 2M+ Stack Overflow posts to map how people actually write Python.

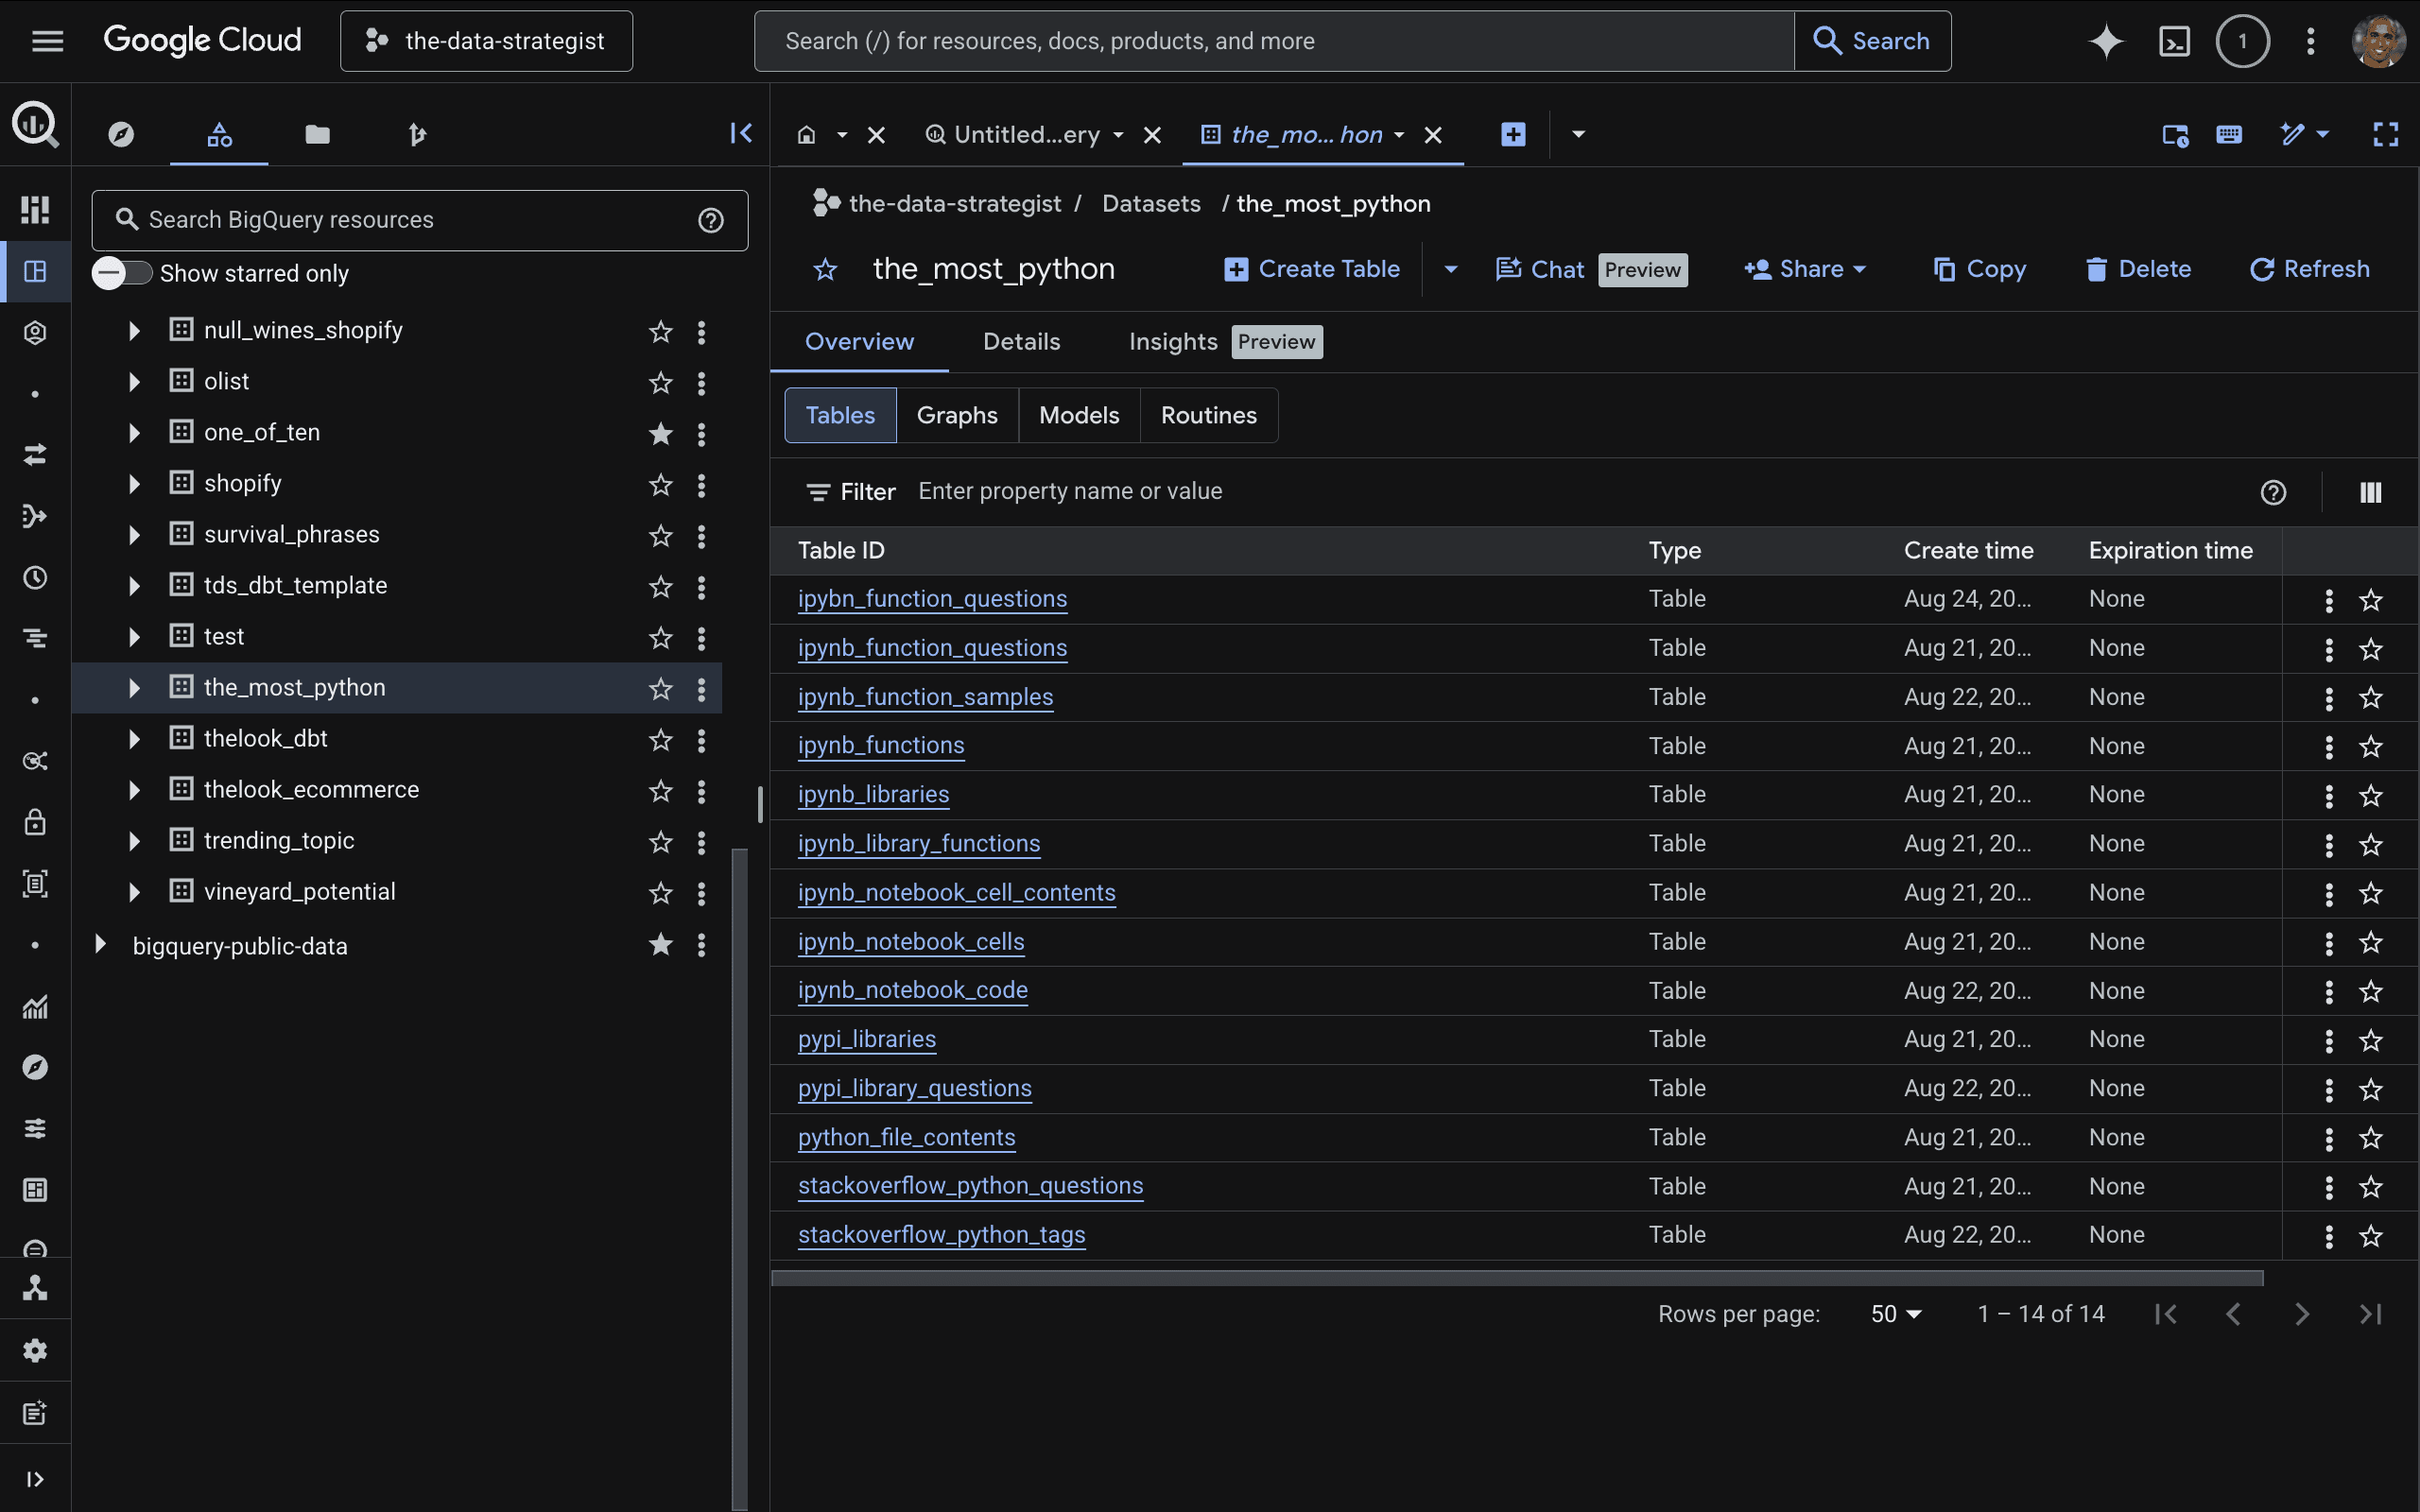


OVERVIEW
What 200,000 Notebooks Reveal About Real Python
An analysis of 200,000 IPython/Jupyter notebooks and more than 2 million Stack Overflow posts to find Python's most common code, libraries, and questions.
Instead of opinion about what Python developers should use, the report measures what they actually use, drawn from public code and public questions at scale.
The work became a widely read dashboard and write-up on how Python is really written in practice.
The Challenge
Turning two large, messy public corpora into a clean picture meant solving several problems at once:
Collecting and parsing 200K notebooks of varying quality
Processing 2M+ Stack Overflow posts
Extracting libraries, functions, and patterns from raw code
Aggregating it all into comparable, rankable signals
APPROACH
The Approach
I built an analysis pipeline that:
Parsed notebook and post content into structured records
Extracted imports, library usage, and code patterns
Counted and ranked usage across both corpora
Compared what people write against what they ask about
Published the results as an interactive dashboard
Core architecture:
Python for parsing and analysis
BigQuery for storage and large-scale aggregation
SQL for ranking and comparison queries
Looker Studio for the public dashboard
Technical Stack
Python
BigQuery
SQL
Looker Studio
Data Visualization
RESULTS
Key Outcomes
Analyzed 200,000+ Jupyter notebooks
Processed 2,000,000+ Stack Overflow posts
Ranked Python's most-used libraries, functions, and patterns
Published a public dashboard and write-up
Built a repeatable method for measuring real-world language usage
Why This Matters
Technology choices are often driven by hype rather than evidence. This report showed a different approach: measure behavior at scale and let the data describe what is actually common. The same method (analyze large public corpora to map real usage) applies well beyond Python, to any ecosystem where adoption is debated more than it is measured.
Looking Forward
Possible extensions:
Tracking library usage trends over time
Comparing usage across languages and ecosystems
Linking common questions to common errors
Refreshing the analysis as the corpora grow
Interested in building something similar?
We help organizations design scalable AI and analytics infrastructure for:
forecasting
growth analytics
operational automation
machine learning platforms
agentic AI workflows
cloud-native data systems
Let’s build systems that turn data into operational leverage.
