YouTube Virality Analysis
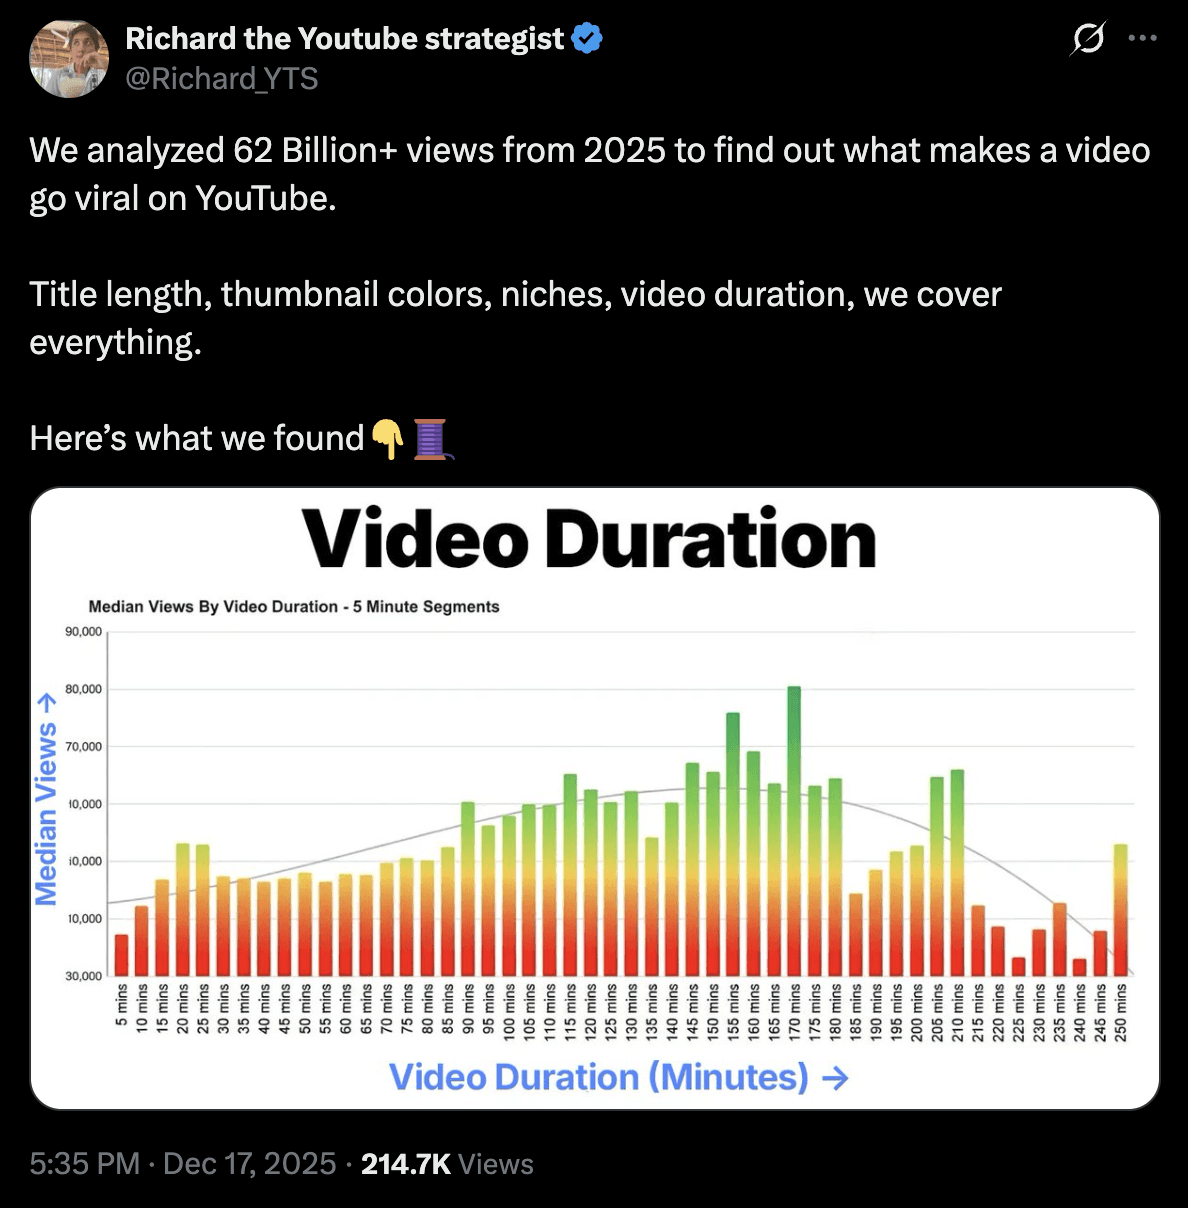
Turning 300,000+ YouTube videos into a measurable model of what actually drives views — built for 1of10.





OVERVIEW
What Drives YouTube Performance at Scale
Built for 1of10, a platform that helps creators understand why some videos explode and others stall. The goal was not a deck of interesting findings. It was a system that produces measurable business outcomes.
We assembled a dataset of more than 300,000 YouTube videos spanning many channels, niches, and audience sizes, then used BigQuery, Vertex AI, and Python to turn unstructured metadata, titles, and thumbnails into measurable signals creators could act on.
The scale was necessary, not academic. Virality is a rare event, and you need enough signal to separate the real drivers from noise.
The Challenge
Most content-strategy advice is subjective and anecdotal. The work was to replace opinion with measurement:
Collect and process video-level metadata at scale
Engineer features that actually predict performance
Normalize results across channels of very different sizes
Find measurable indicators of virality
Turn raw YouTube data into decisions a creator can make
The pipeline had to handle large-scale ingestion while staying flexible enough for fast experimentation.
APPROACH
The Approach
I built an analytics and ML workflow that:
Ingested YouTube metadata across 300,000+ videos
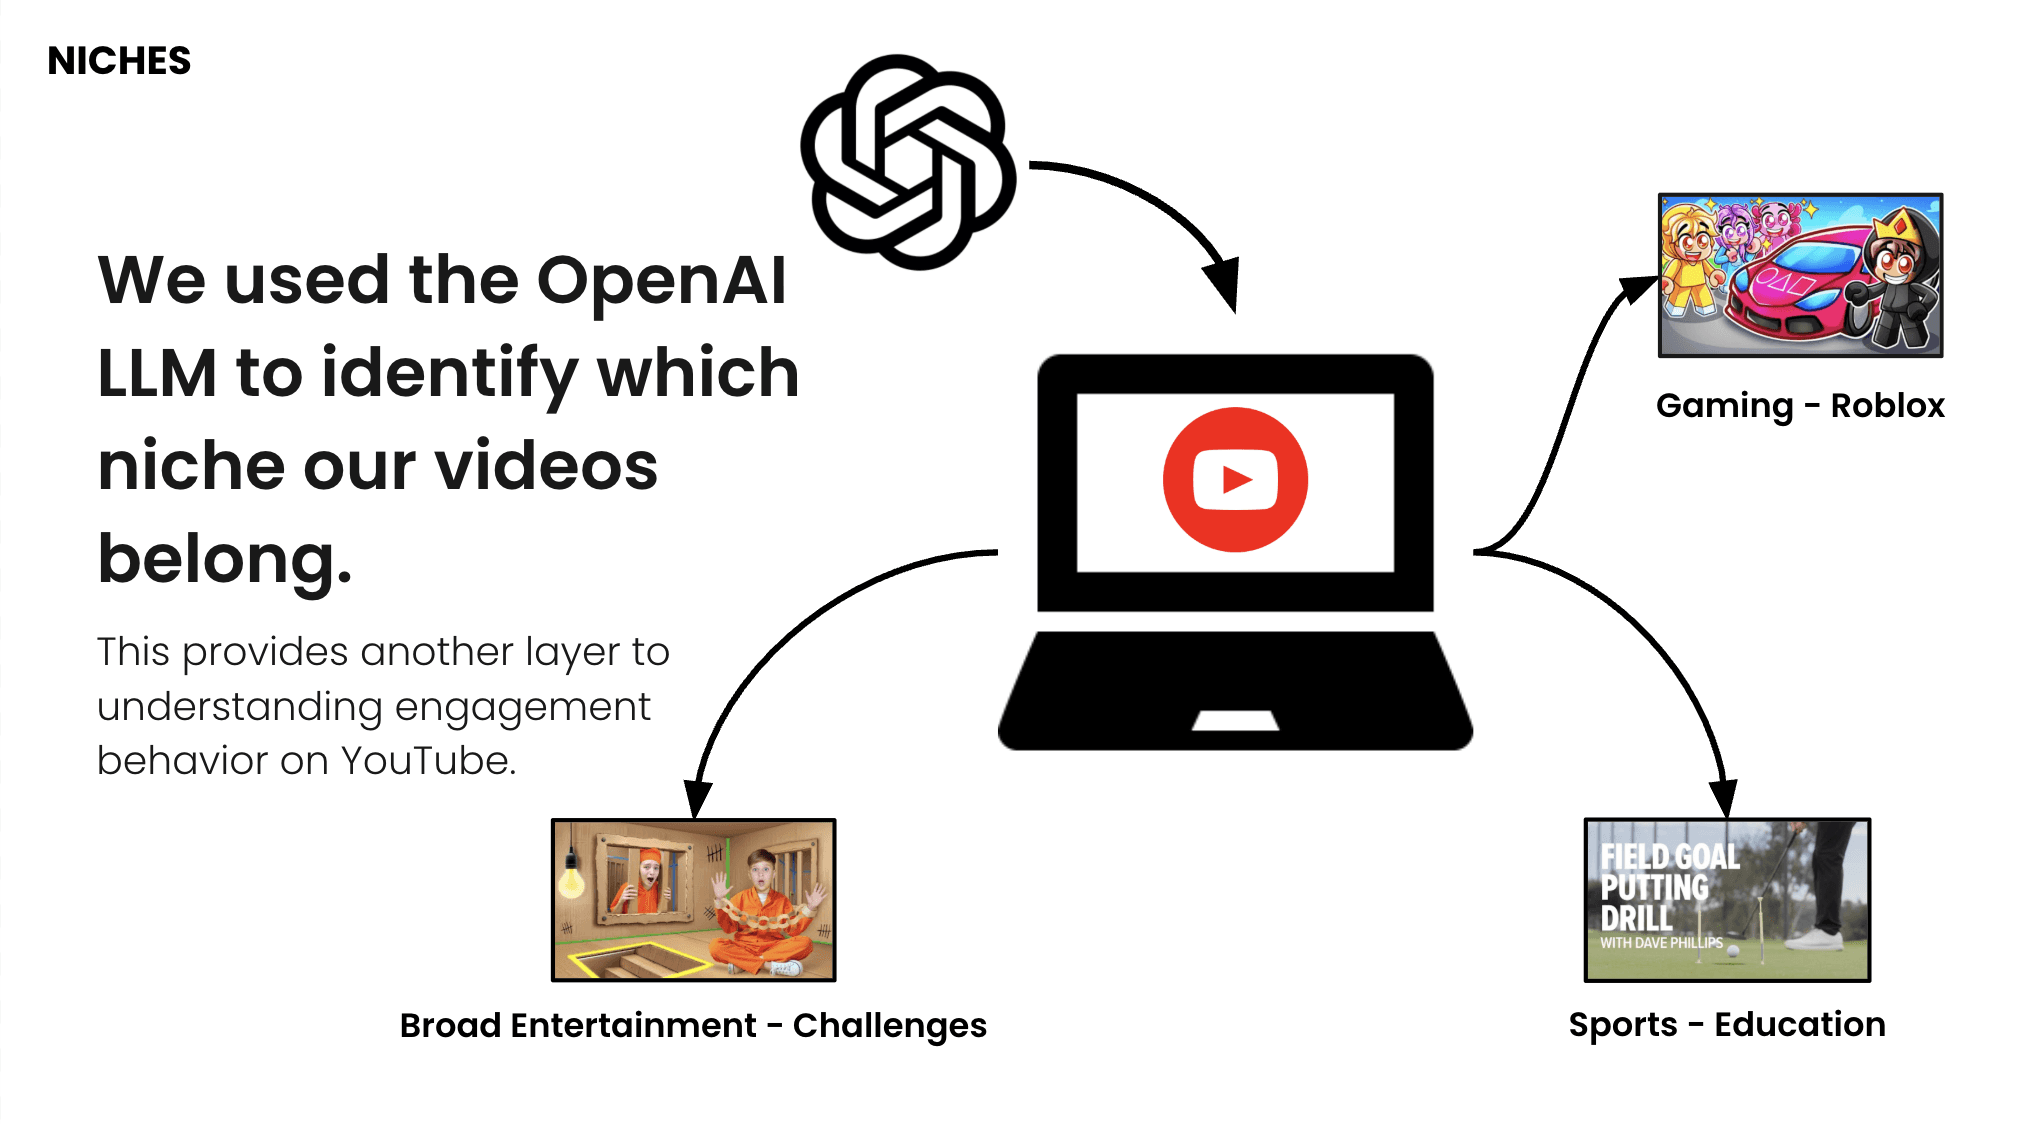
Processed titles and thumbnail features, including OCR and vision signals
Generated structured performance metrics normalized per channel
Created derived engagement and virality indicators
Modeled the relationship between metadata and view performance
It combined statistical analysis, feature engineering, and ML experimentation to surface the patterns with real signal rather than coincidence.
Core architecture:
Python data pipelines for ingestion and processing
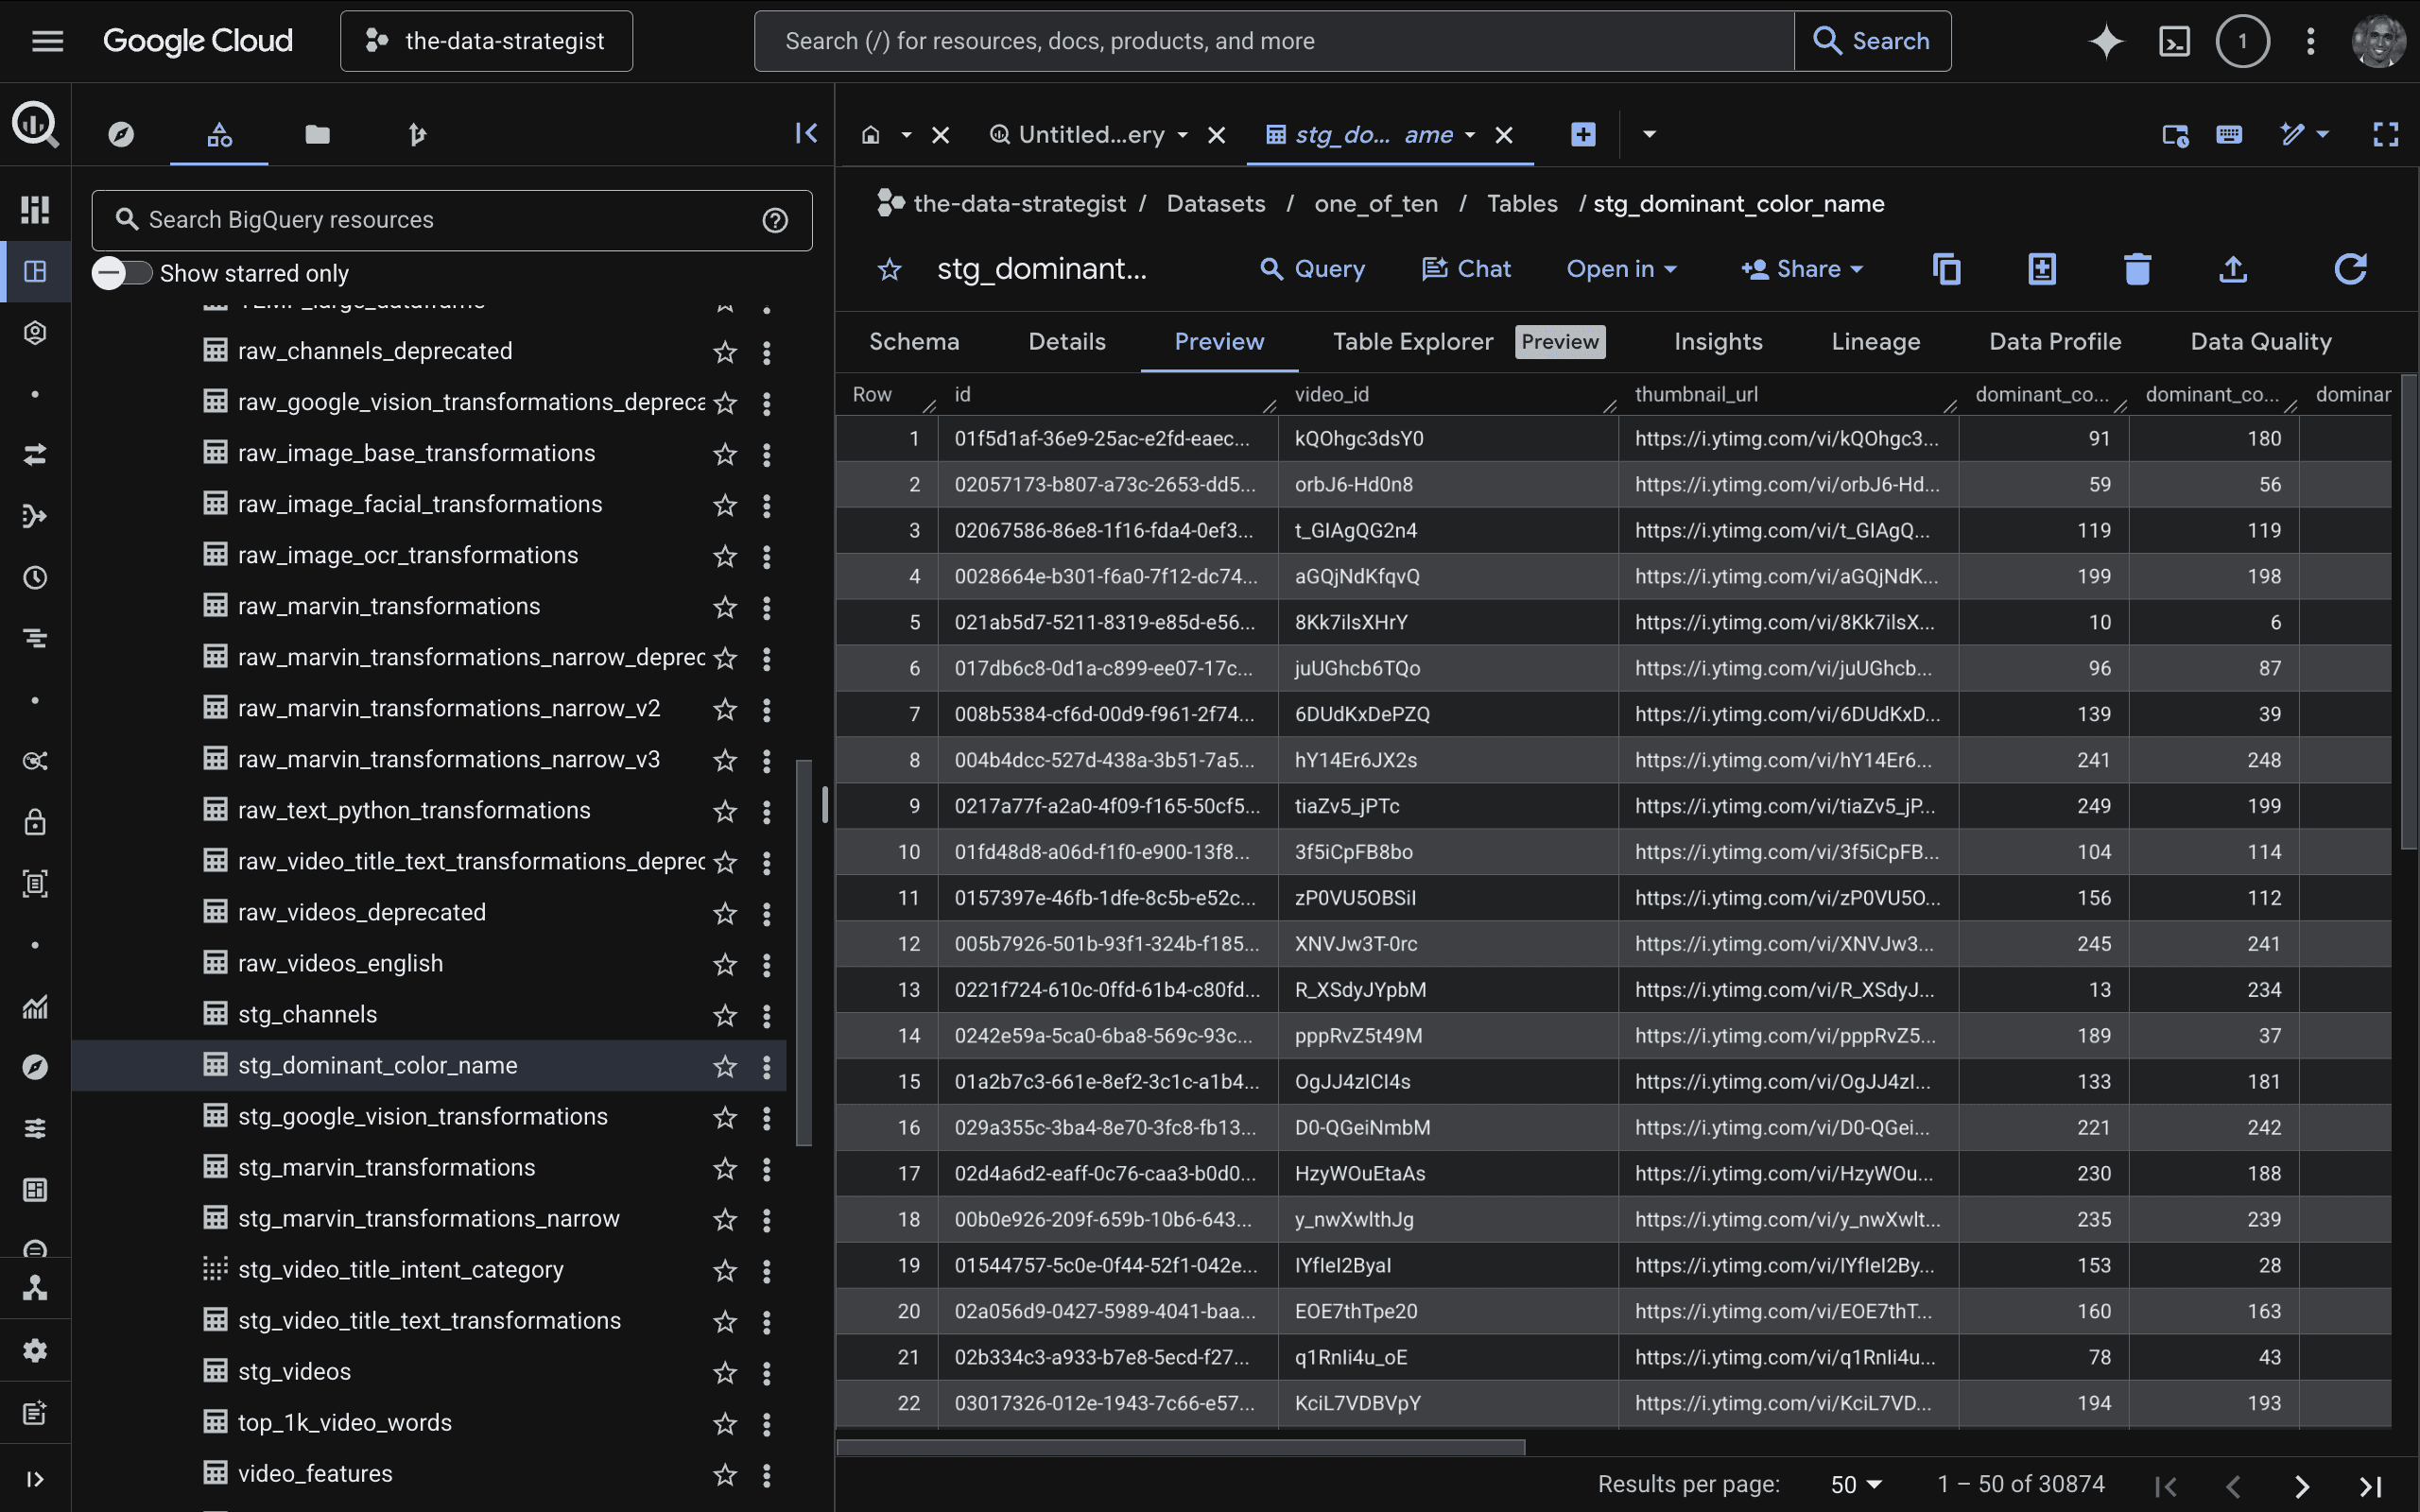
BigQuery for analytical storage and large-scale querying
Feature-engineering workflows producing 300+ signals
Thumbnail analysis using Google Vision and OCR
Vertex AI for ML experimentation
Automated reporting and analysis layers
The design left room for the obvious next step: turning the analysis into recommendation and optimization models.
Technical Stack
Python
BigQuery
Vertex AI
Google Vision
SQL
Data Visualization
OpenAI API
Google Cloud Platform
RESULTS
Key Outcomes
Processed 300,000+ YouTube videos
Engineered 300+ metadata features
Identified measurable patterns tied to viral performance
Informed strategy that contributed to 200,000+ additional views
Helped drive acquisition of 100+ new customers
Why This Matters
Media companies increasingly compete on data-driven content optimization. This project showed how analytics and AI can:
Reduce creative guesswork
Sharpen content strategy with evidence
Scale experimentation past gut feel
Build a repeatable growth framework
The same approach transfers to marketing, e-commerce, and any creator business where the inputs are unstructured and the outcome is a rare event.
Looking Forward
Planned next steps:
AI-generated title recommendations
Thumbnail scoring models
Real-time performance forecasting
Recommendation systems for creators
Multi-platform virality benchmarking
Interested in building something similar?
We help organizations design scalable AI and analytics infrastructure for:
forecasting
growth analytics
operational automation
machine learning platforms
agentic AI workflows
cloud-native data systems
Let’s build systems that turn data into operational leverage.
