
A small collection of work from publicly available data and showcase projects where clients have given permission.

1of10.com: YouTube Virality Analysis
This is the story of a project we built for 1of10 — a platform that helps creators understand why some videos explode and others don't. It's also a case study in what applied analytics actually looks like when it's done right: not a deck of interesting findings, but a system that produces measurable business outcomes.
We started by building a dataset of 300,000 YouTube videos across a wide range of channels, niches, and audience sizes. The scale wasn't academic — it was necessary. Virality is a rare event. To find statistically meaningful patterns in what drives it, you need enough signal to separate true drivers from noise.
LinkedIn Article | the Data Edge
tDS: 1of10 Exploratory Analysis | What's In a Viral Name? | Google Slides
1of10.com | Insights Project Tracker | Google Sheets

Restaurant Revenue Forecasting with dbt + BigQueryML
🚀 Overview
Built a scalable forecasting system to predict hourly revenue for 50+ restaurants, up to 30 days in advance, using dbt + BigQueryML. The system integrates directly into the data warehouse, enabling continuous, automated predictions that outperform traditional operational forecasting methods.
🎯 The Problem
Restaurant operators were:
Relying on manual or heuristic-based forecasts
Struggling to predict demand at an hourly level
Experiencing inefficiencies in staffing, inventory, and operations
This process was time-consuming, inconsistent, and prone to delays and missed requests.
🎯 The Solution
We developed a production-grade ML forecasting system fully embedded in BigQuery:
Feature Engineering with dbt
Built structured, reusable models using dbt
Created features related time horizons, sales metrics, weather, holidays, and local events
Built ensemble models in with BigQueryML, including:
K-means clustering
Gradient boosted regressors
Random foreasts
Generated a forecasting pipeline:
Forecasts at the hourly, daily, and weekly level
Forecasts up to 30 days into the future
Compares performance to clients' existing forecasts
Used Prefect to orchestrate:
Schedule recurring model training and prediction
Ensure reliable, productionized workflows
Used Prefect to orchestrate:
Schedule recurring model training and prediction
Ensure reliable, productionized workflow
Prediction Tracking System
Logs every training, prediction, and forecasting event
Evaluates predictions and tracks model drift
⚙️ Impact
< 5% weekly forecast errors
~ 50% improvements from operational teams' forecast errors
Improved staffing efficiency and inventory planning

Hotel Operations Automation with n8n
🚀 Overview
Built an end-to-end automation system for a property management company operating 300+ Airbnb properties, designed to streamline how guest issues are identified and resolved.
The system analyzes every guest conversation, determines whether action is needed, and automatically creates and assigns operational tasks—eliminating manual triage.
🎯 The Problem
Property managers were manually:
Monitoring guest messages across platforms
Identifying issues requiring action (cleaning, maintenance, etc.)
Creating tickets in their operations system
Assigning tasks to the appropriate team
This process was time-consuming, inconsistent, and prone to delays and missed requests.
🎯 The Solution
We built an automated dispatch system using n8n that:
Analyzes Guest Conversations
Reviews every inbound guest message
Determines whether a dispatch is required (cleaning, maintenance, etc.)
Creates Operational Tickets
Automatically generates a ticket in Breezeway for each valid request
Assigns the Right Team
Routes tickets to the appropriate team (housekeeping, maintenance, etc.)
Ensures faster response times and accountability
Fully Automates the Workflow
End-to-end orchestration handled through n8n
No manual intervention required
⚙️ System Architecture (High-Level)
Guest messaging platform
n8n Workflow Engine
Decision logic (dispatch vs. no dispatch) with OpenAI API
Breezeway API (ticket creation)
Notifications in Slack
Automated assignment + tracking in BigQuery
📈 Impact
50+ tickets created automatically per week
10+ hours/week saved for the housekeeping team
Reduced response time for guest issues
Improved operational consistency across properties
Successfully deployed across 300+ Airbnb units
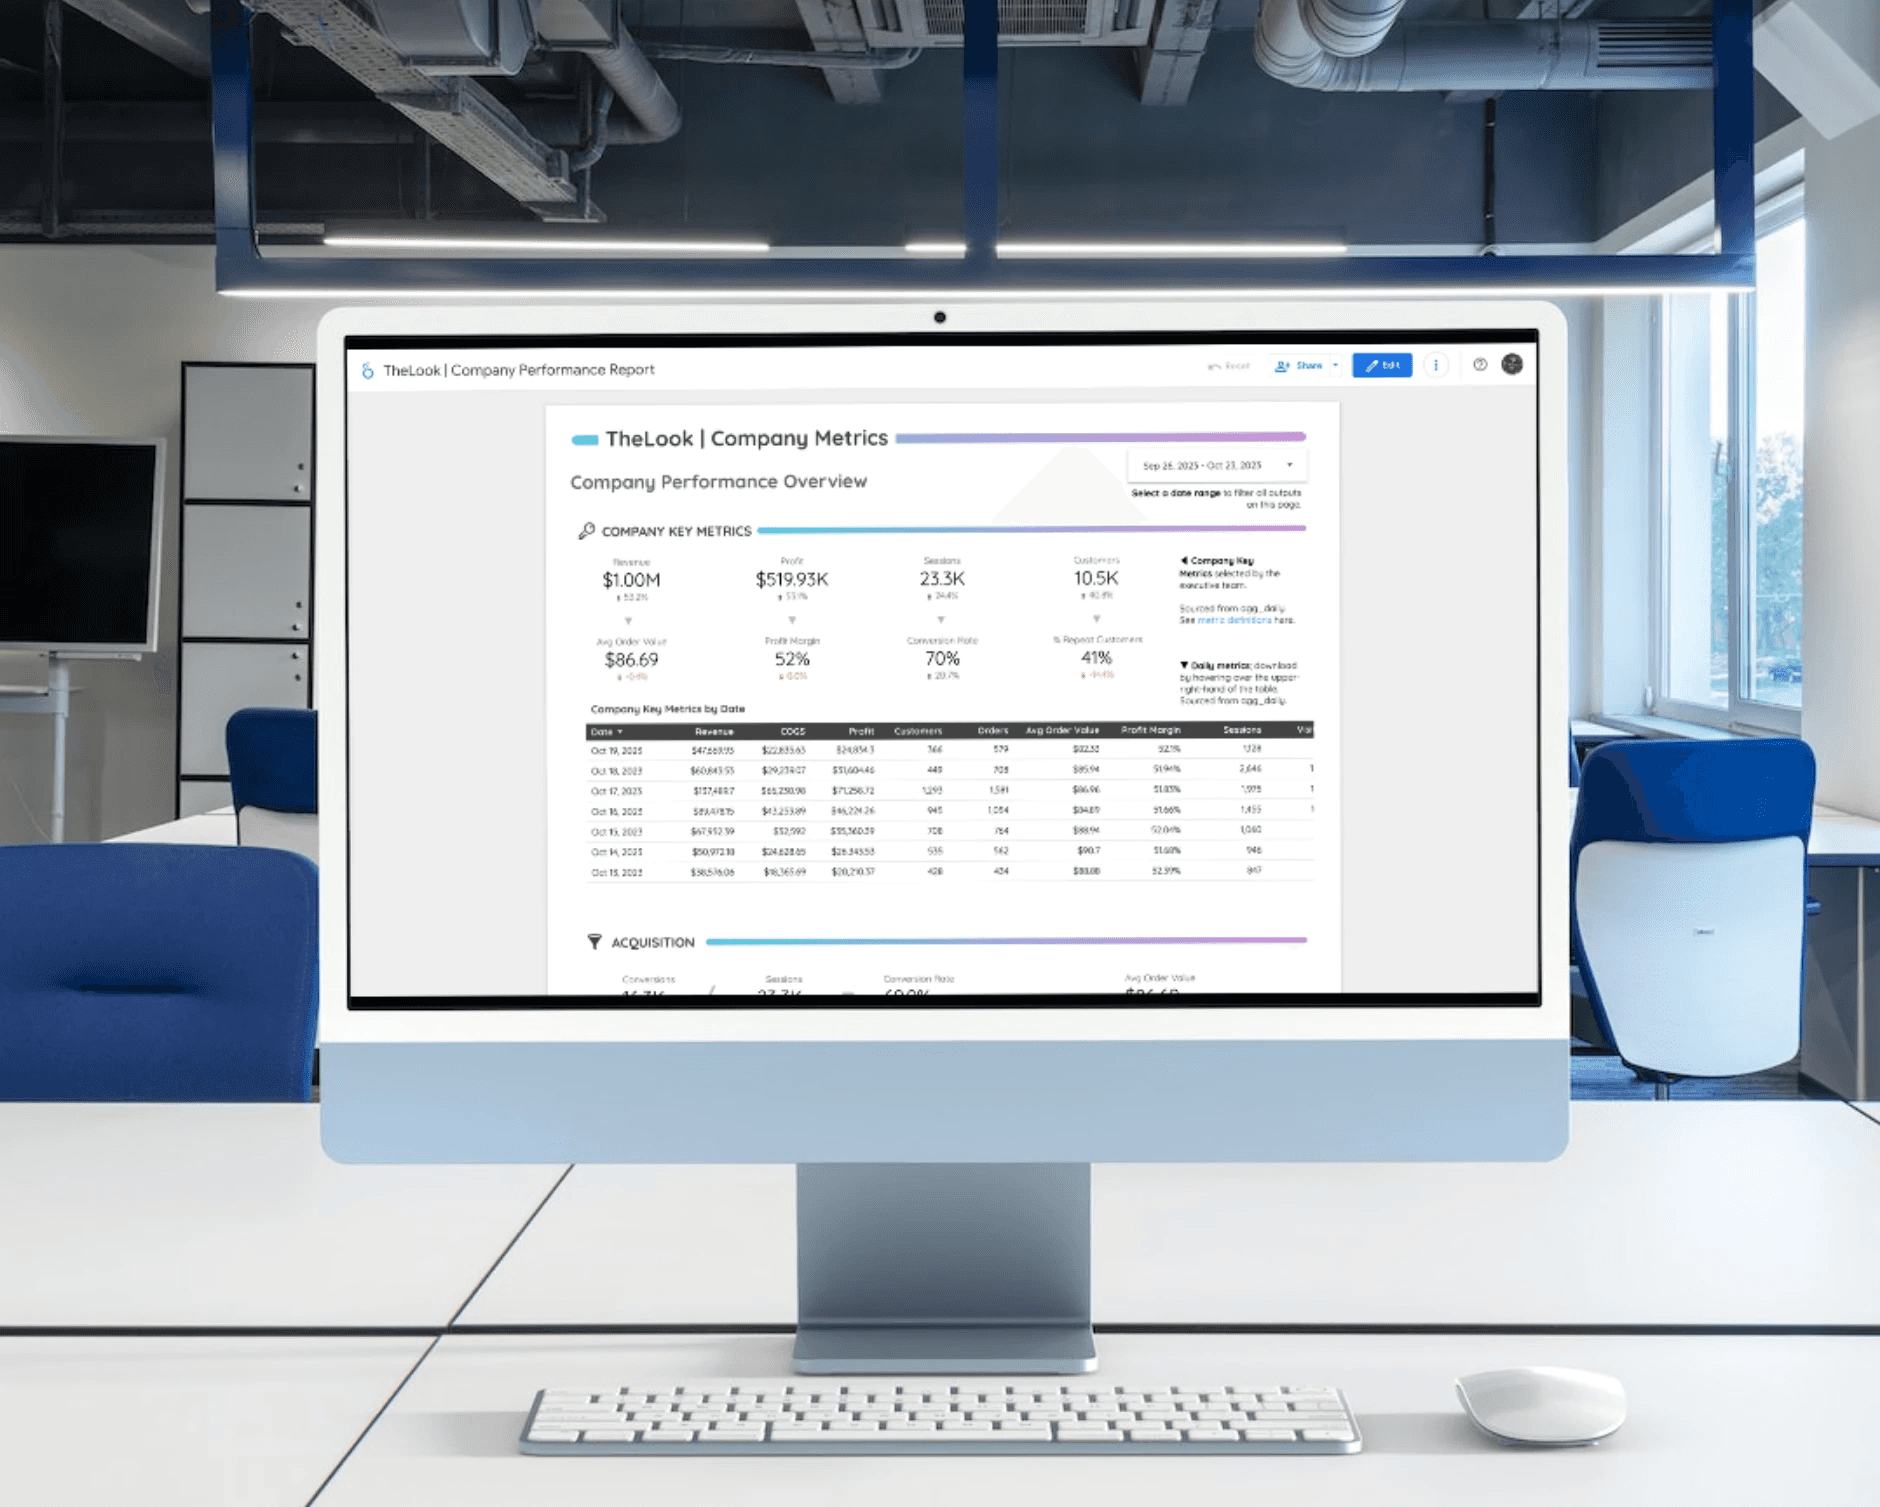
This project incorporates several of components from our Dashboards as a Service offering. We build data pipelines and dashboards using best-in-class services such as Fivetran, Google BigQuery, dbt, and Looker. We combine this with strategic frameworks to ensure the data, metrics, and dashboards are properly understood across the business.
In this project, we use data from a fictitious e-commerce company, TheLook, to build the technical and strategic components below. The source data are publicly available from Google.
Project Brief | Google Docs
TheLook | Company Metrics Dashboard | Looker Studio
dbt Integration | Github
Dashborad Design | Figma
Data & Metrics Catalog | Google Sheets

This notebook allows users to ask written business questions about a fictitious e-commerce company, TheLook. The notebook will respond with an answer, transformed Pandas dataframe, and visualization.
This process is known as semantic querying. Semantic querying is one way we can integrate AI into their analytics process.
Anyone can run this notebook, provided they have a Google Cloud Platform account. Check this link on how to set up Google BigQuery.
Sample Questions
What are our monthly sales and customers? Format the month column as YYYY-MM.
Who are our 50 most profitable customers? How much have each of them spend with us?
In what week did we have the highest sales?

"The Most Python" Report
The How & Why of Enterprise Analytics
A presentation to The Product School in New York City. I discussed the importance and benefits of building an analytics team in a scaleup. At the time, I was leading Spotify's internal data science consulting team, Data SWAT.