
We combine traditional business intelligence with the modern AI stack to produce trustworthy, beautiful, actionable reports.
Let's Talk
Is your business hitting the limits of Excel?
We build scalable data pipelines and clean dashboards so that your reports remain reliable as your business grows.
Get Started

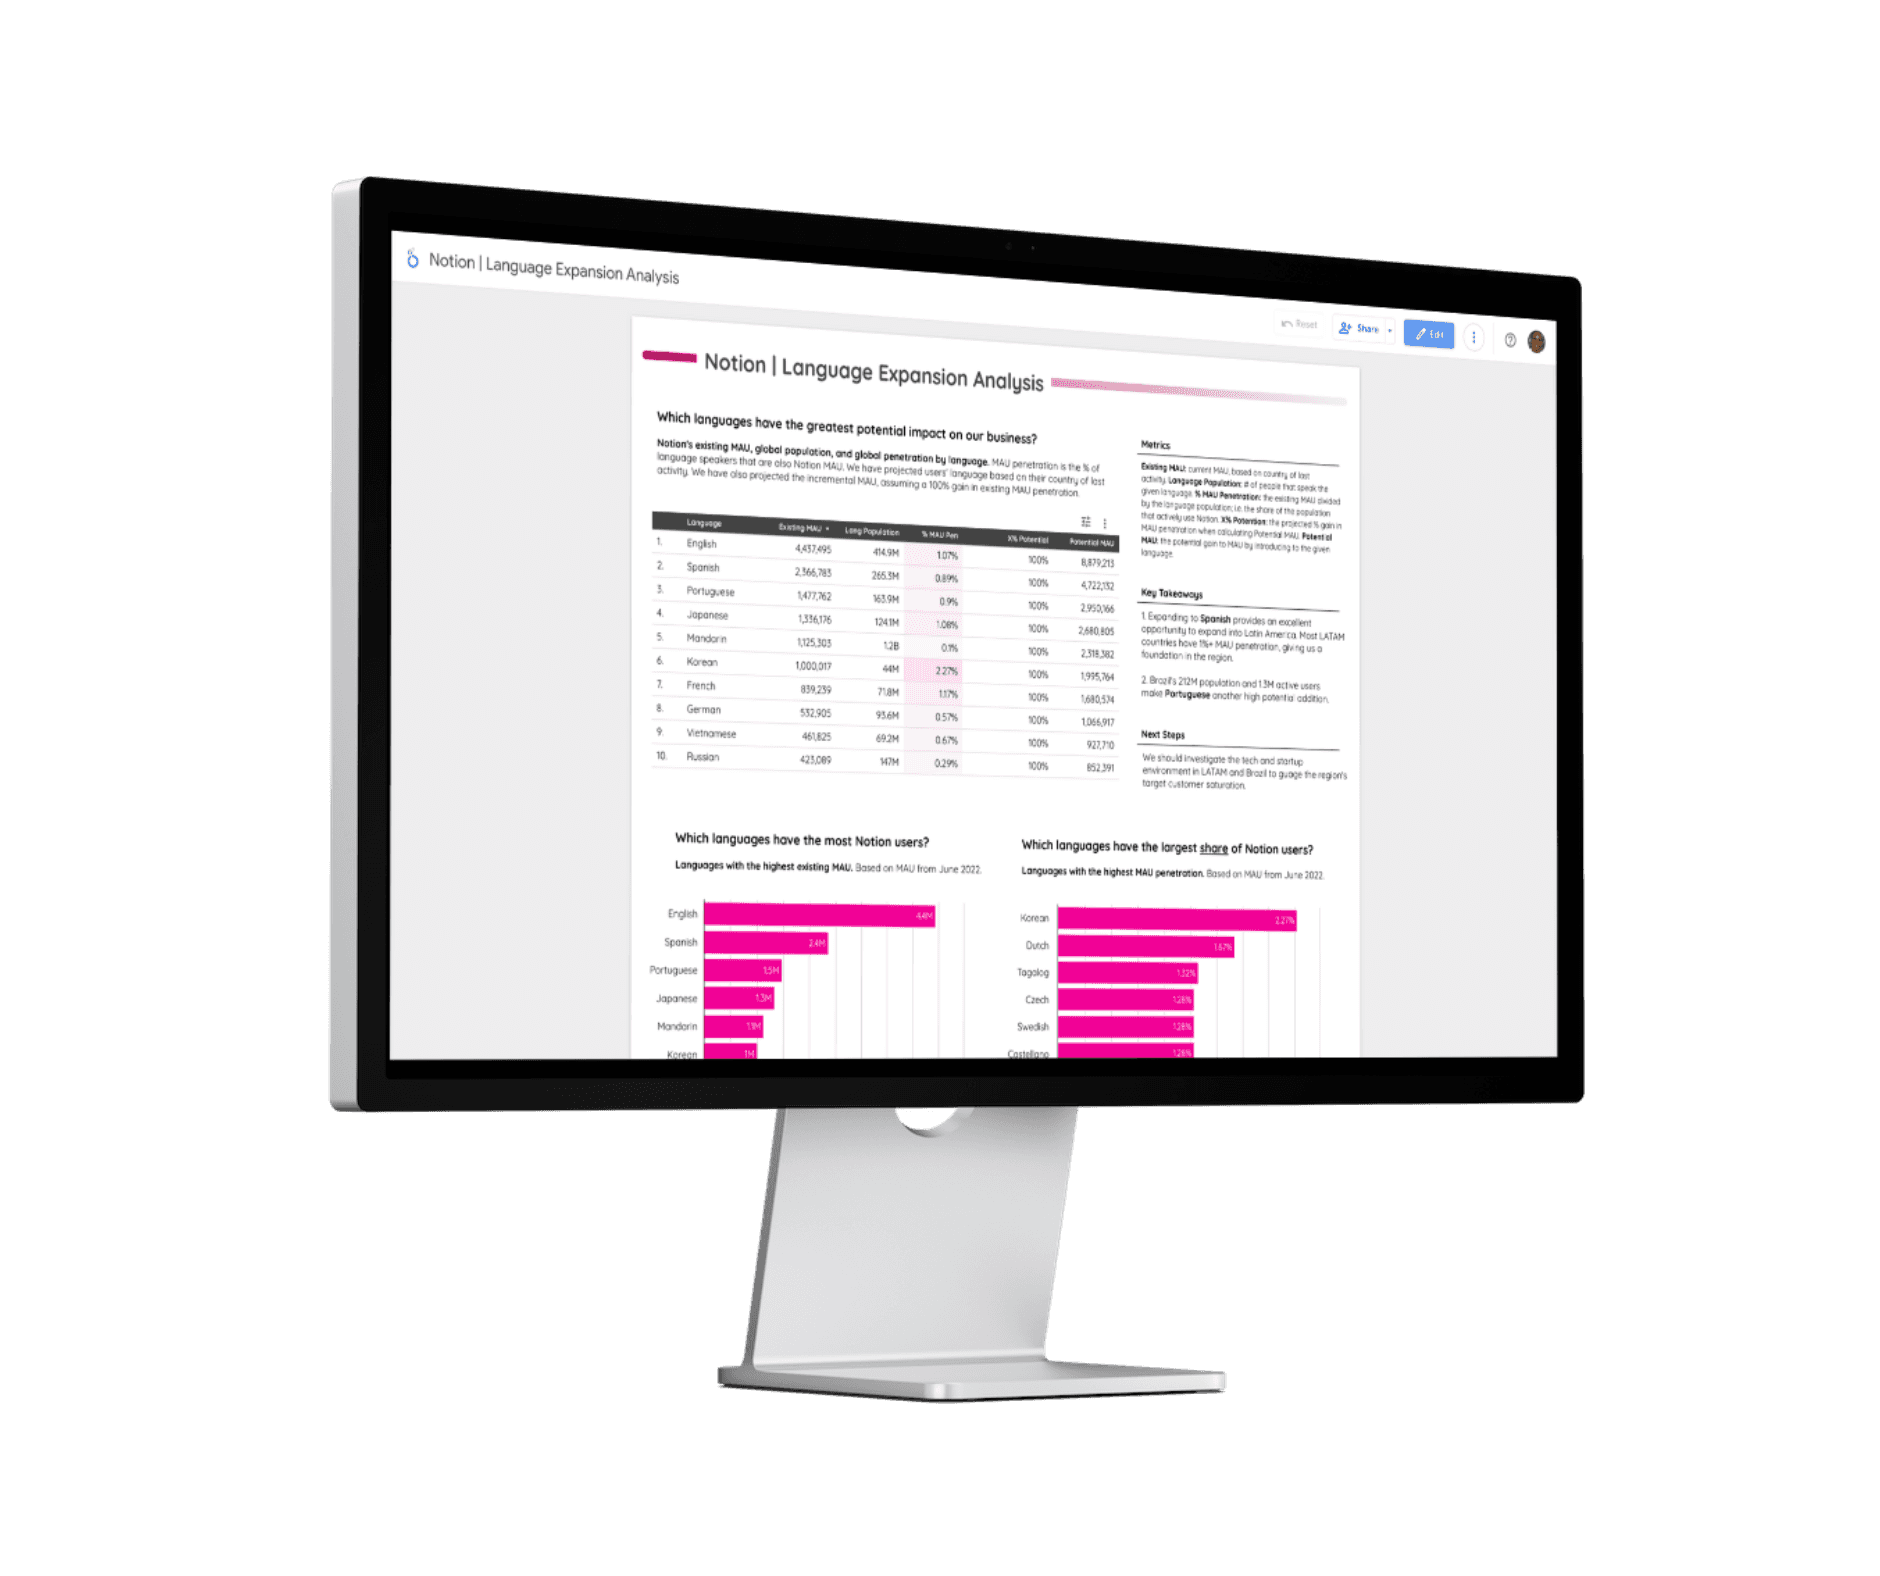
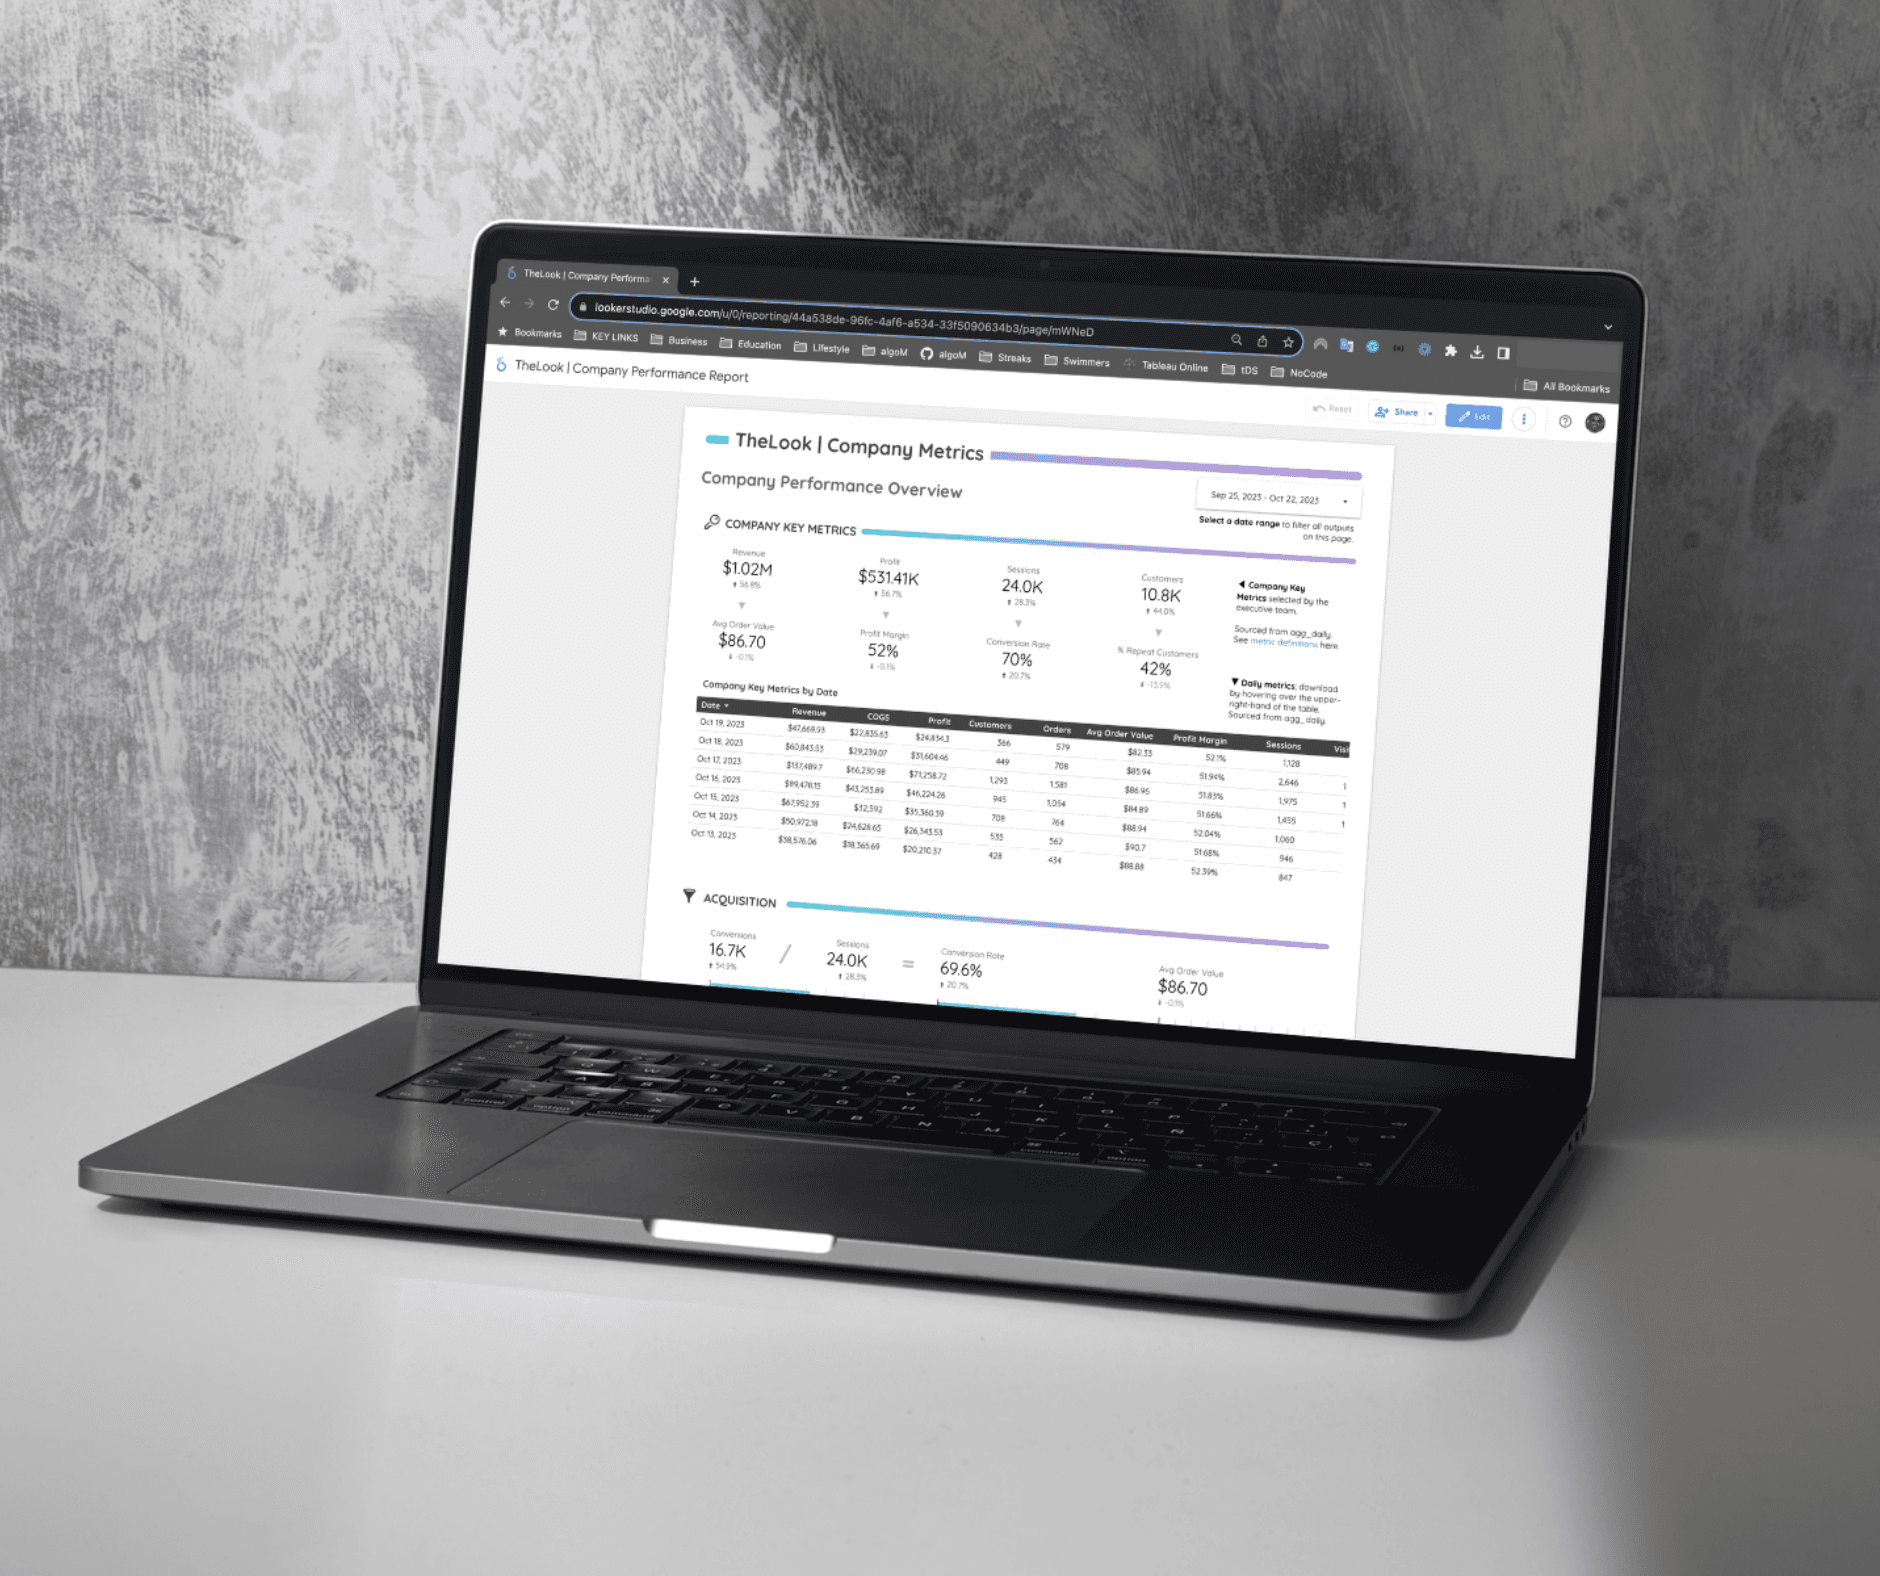
Get high-quality custom dashboards
We use a set of strategic and technical frameworks to ensure your dashboards are build accurately and as expected.
Get Started
Learn More
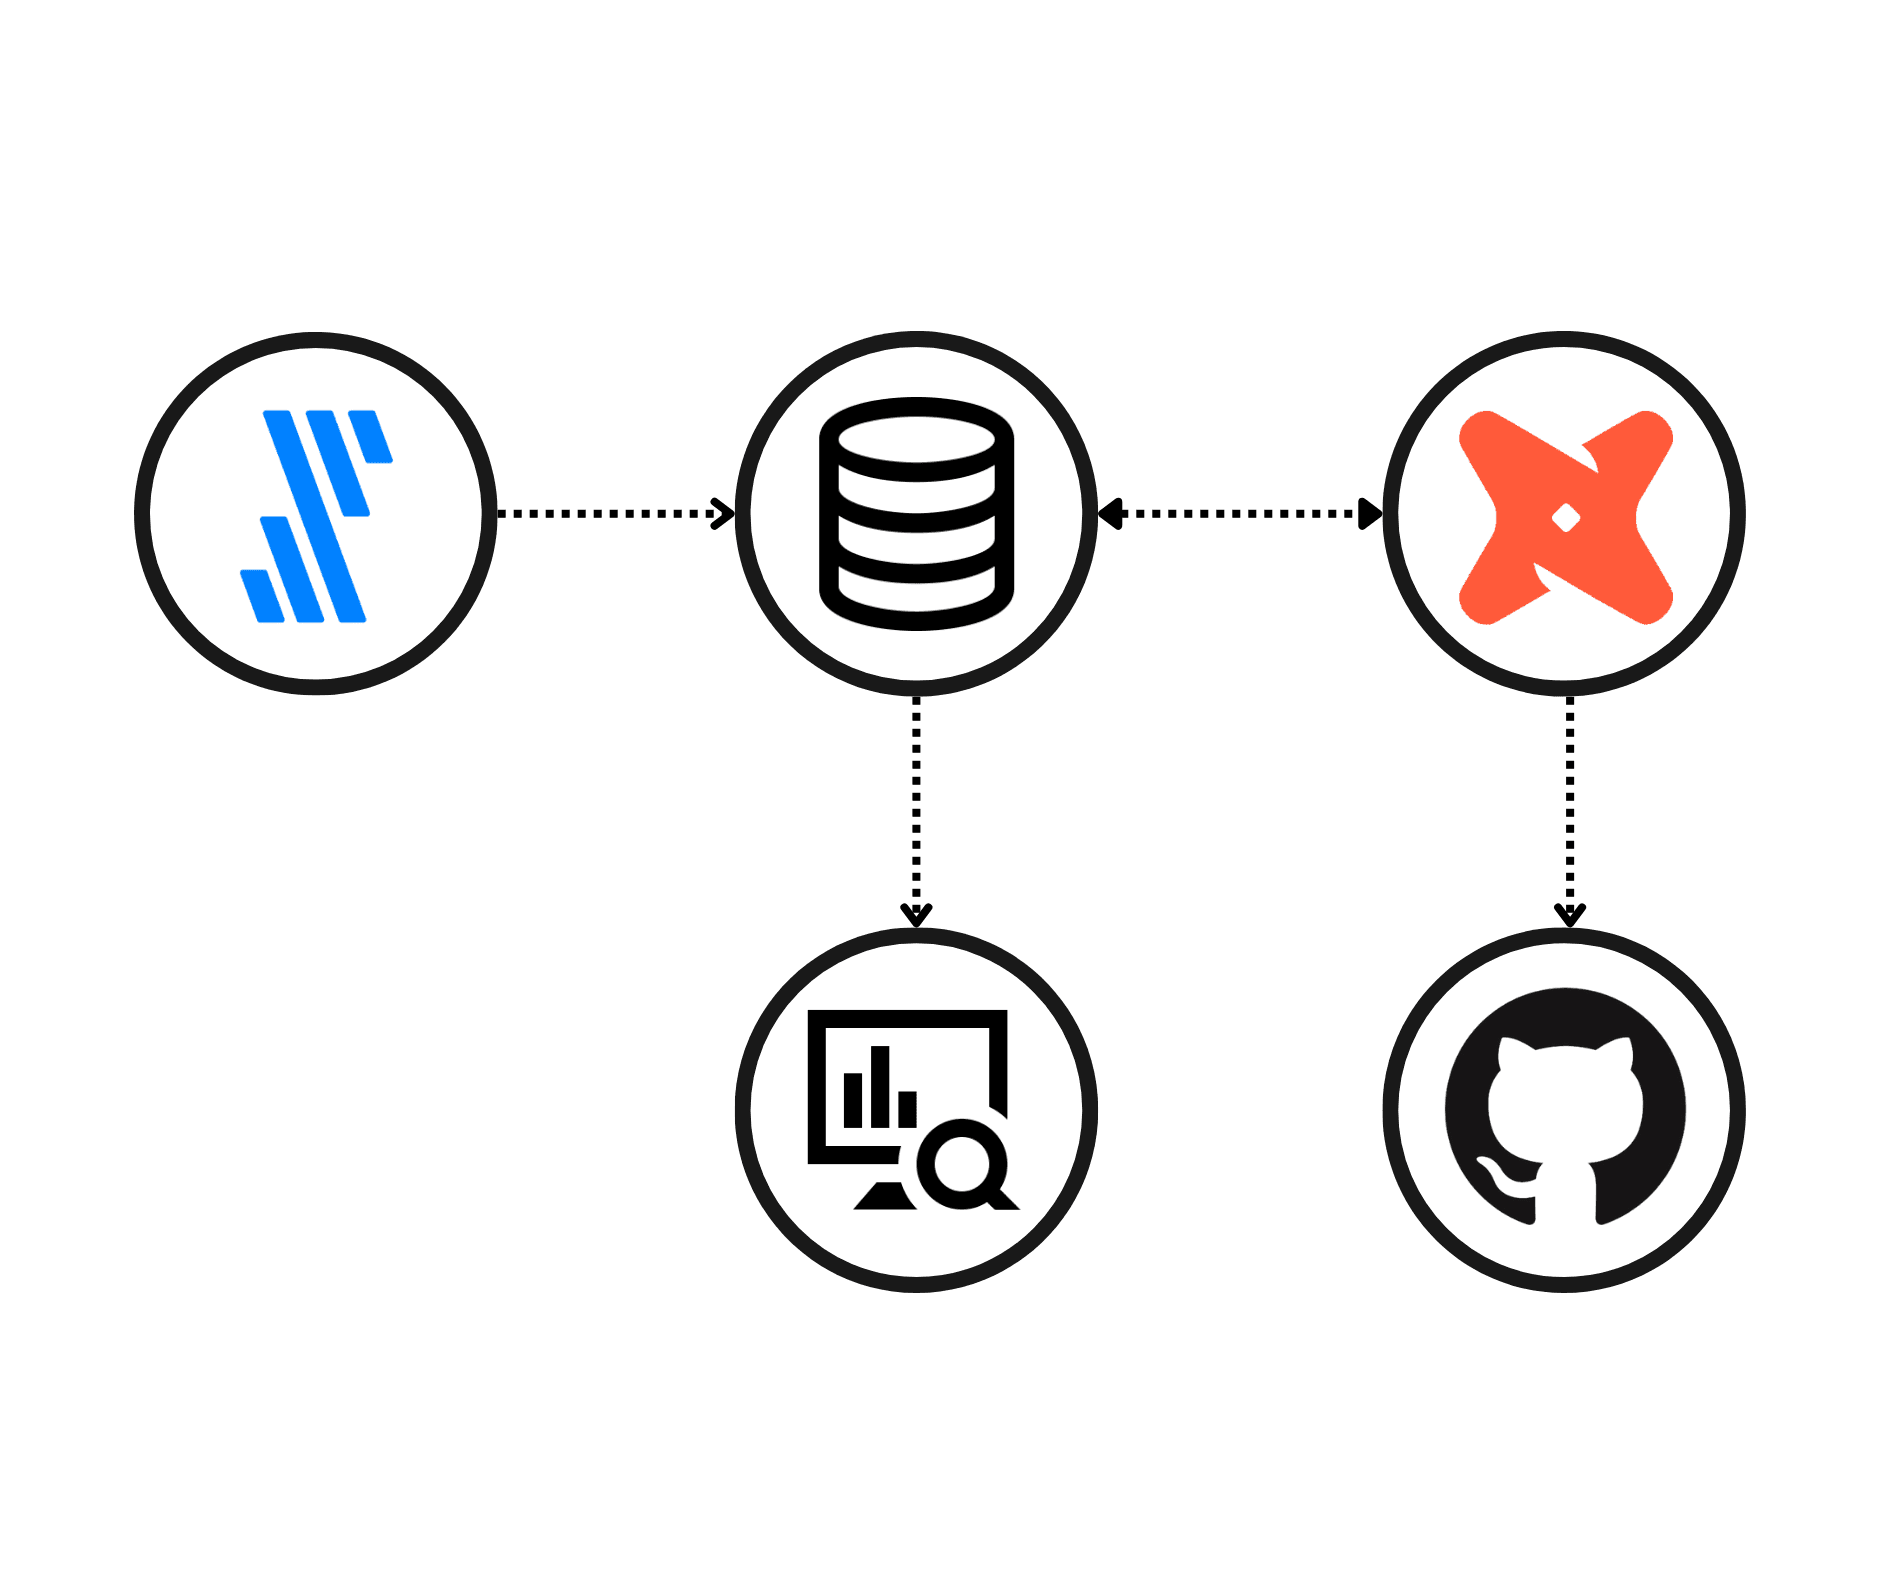
Built on a best-in-class data and AI stack
We build on Google Cloud Platform, dbt, Retool, vibe coding and other best-in-class data and AI software.
Get Started
Learn More
Reporting management as a subscription
We'll manage all of the data pipelines and dashboards we build for your business. Your team can take over whenever you're ready.
Get Started
Learn More
Get a single view of your business.
Get the tools, processes, and talent of a world class analytics team at a fraction of the cost.
Get Started
Learn More
Our Approach to Building Reports
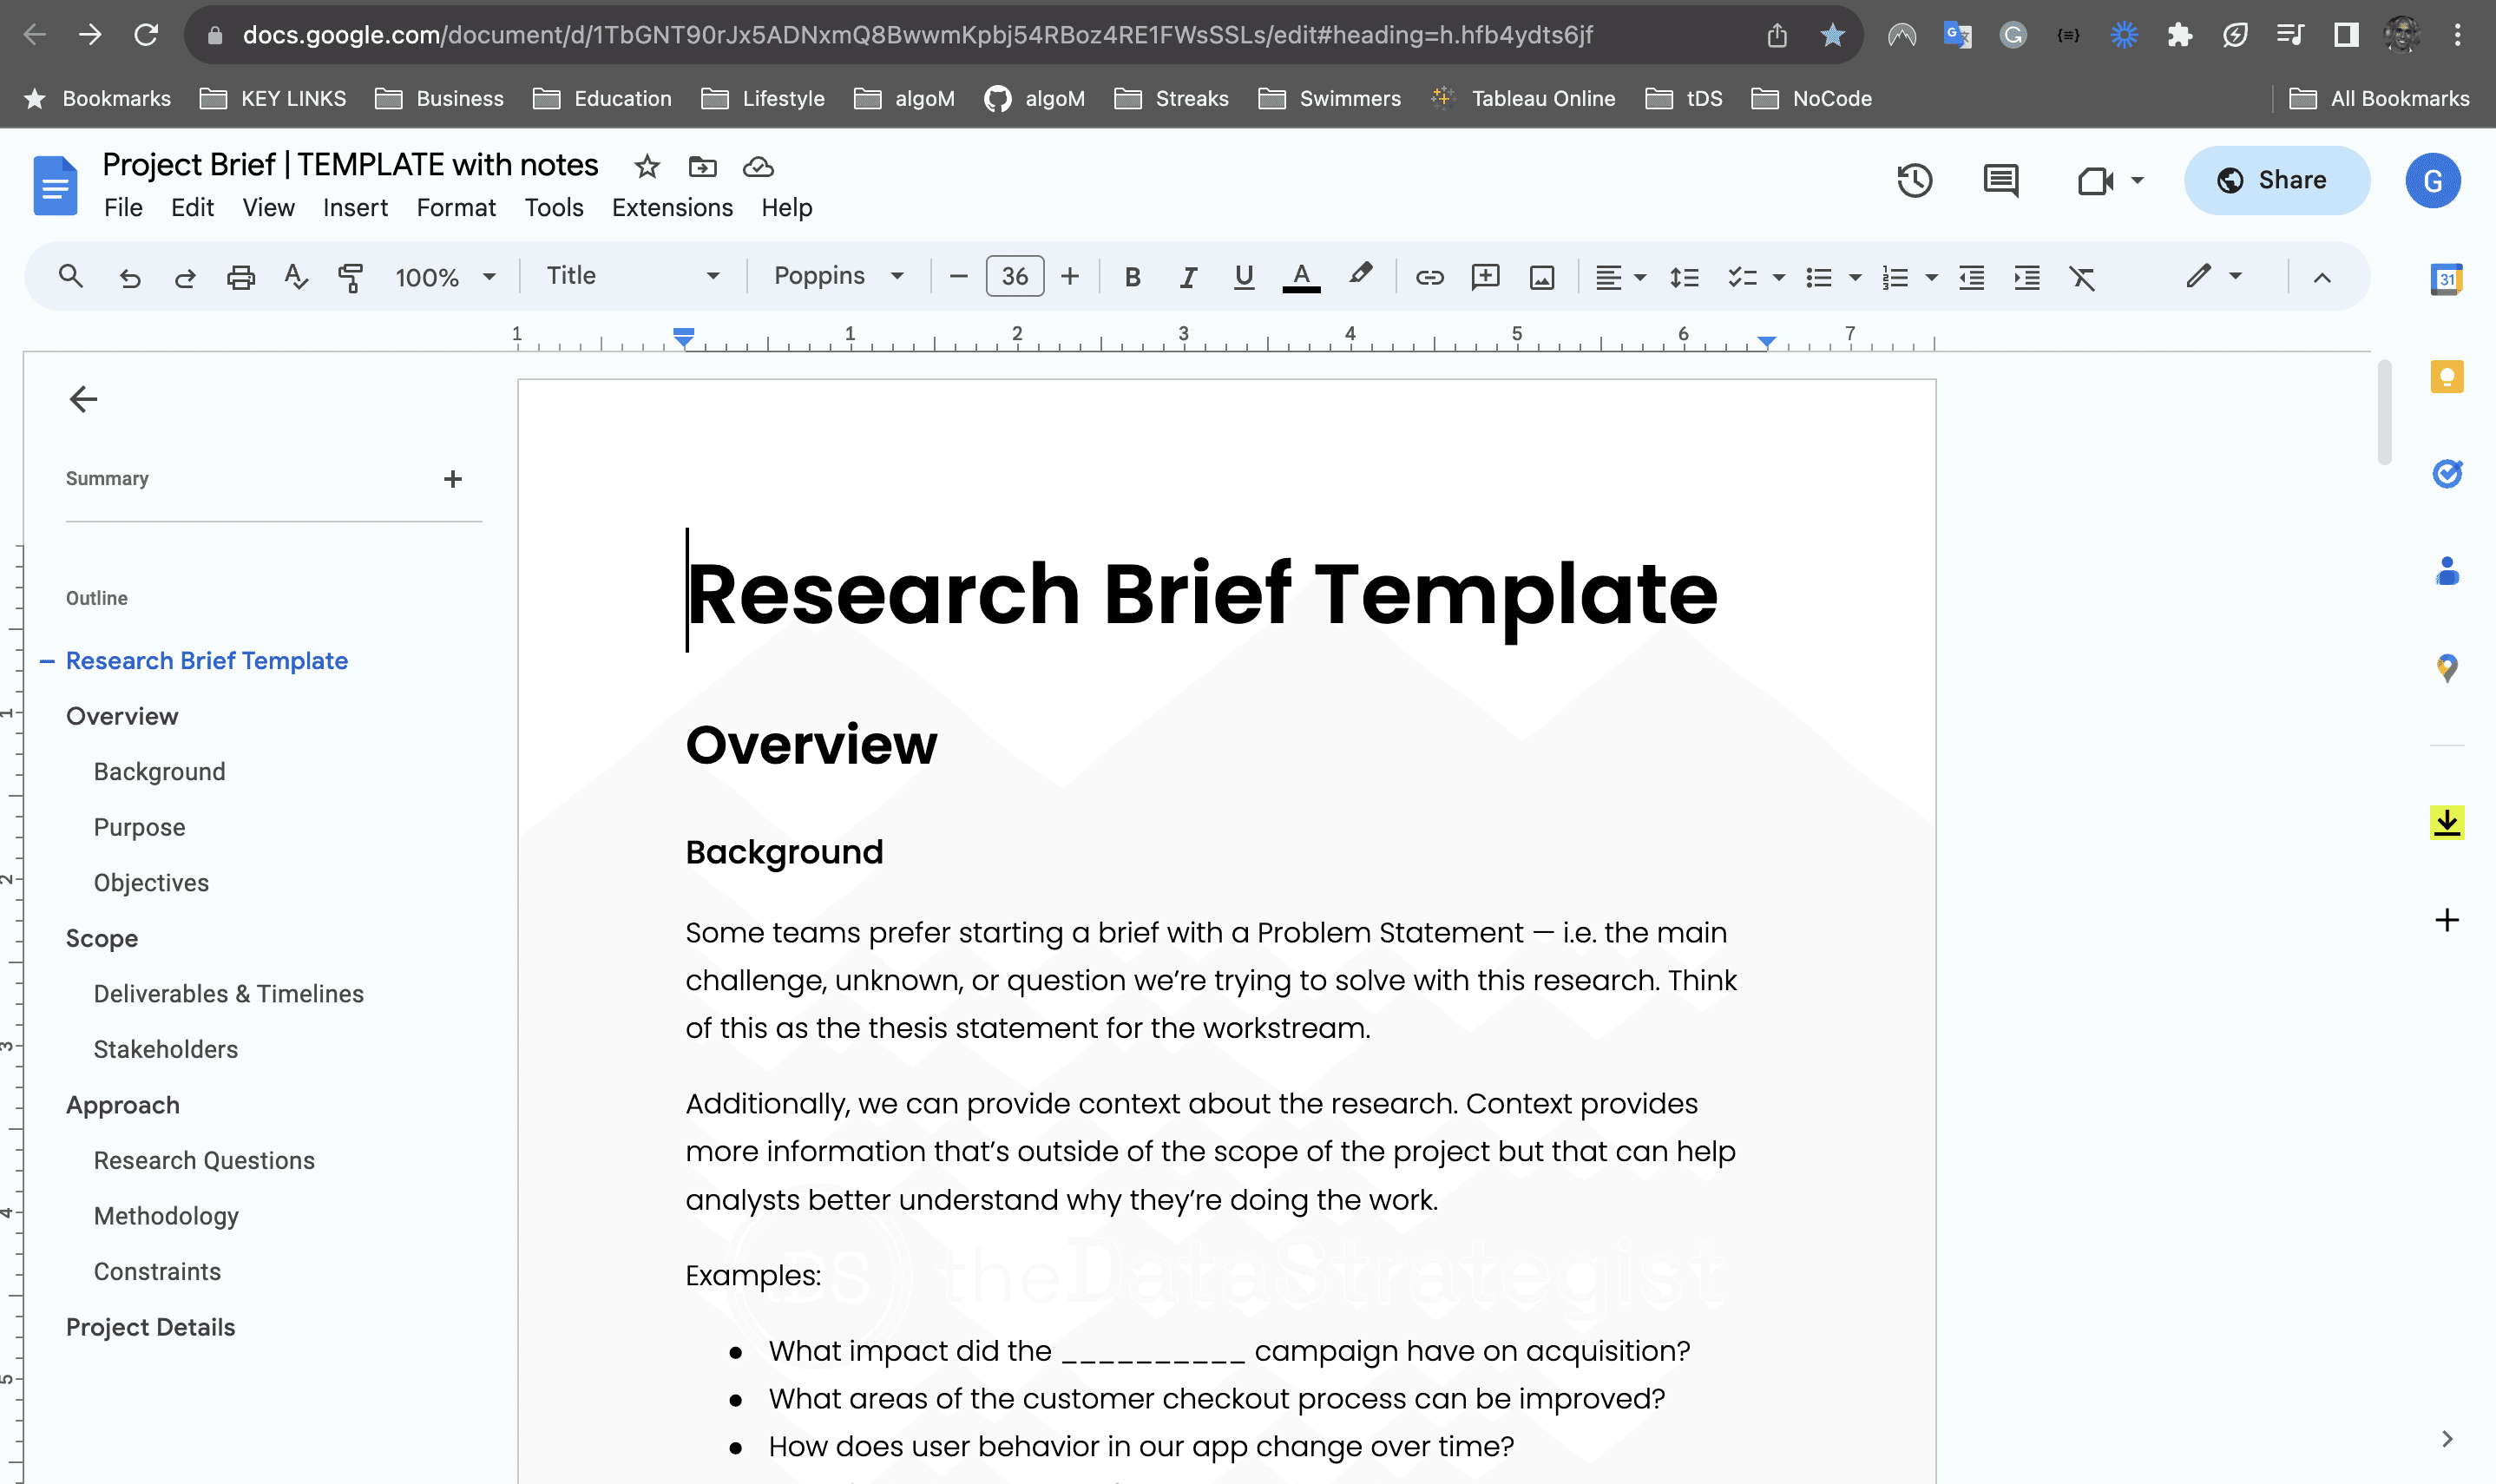
1. Project Brief
We start by drafting a project brief that outlines the steps required. We'll include a time and cost estimate.
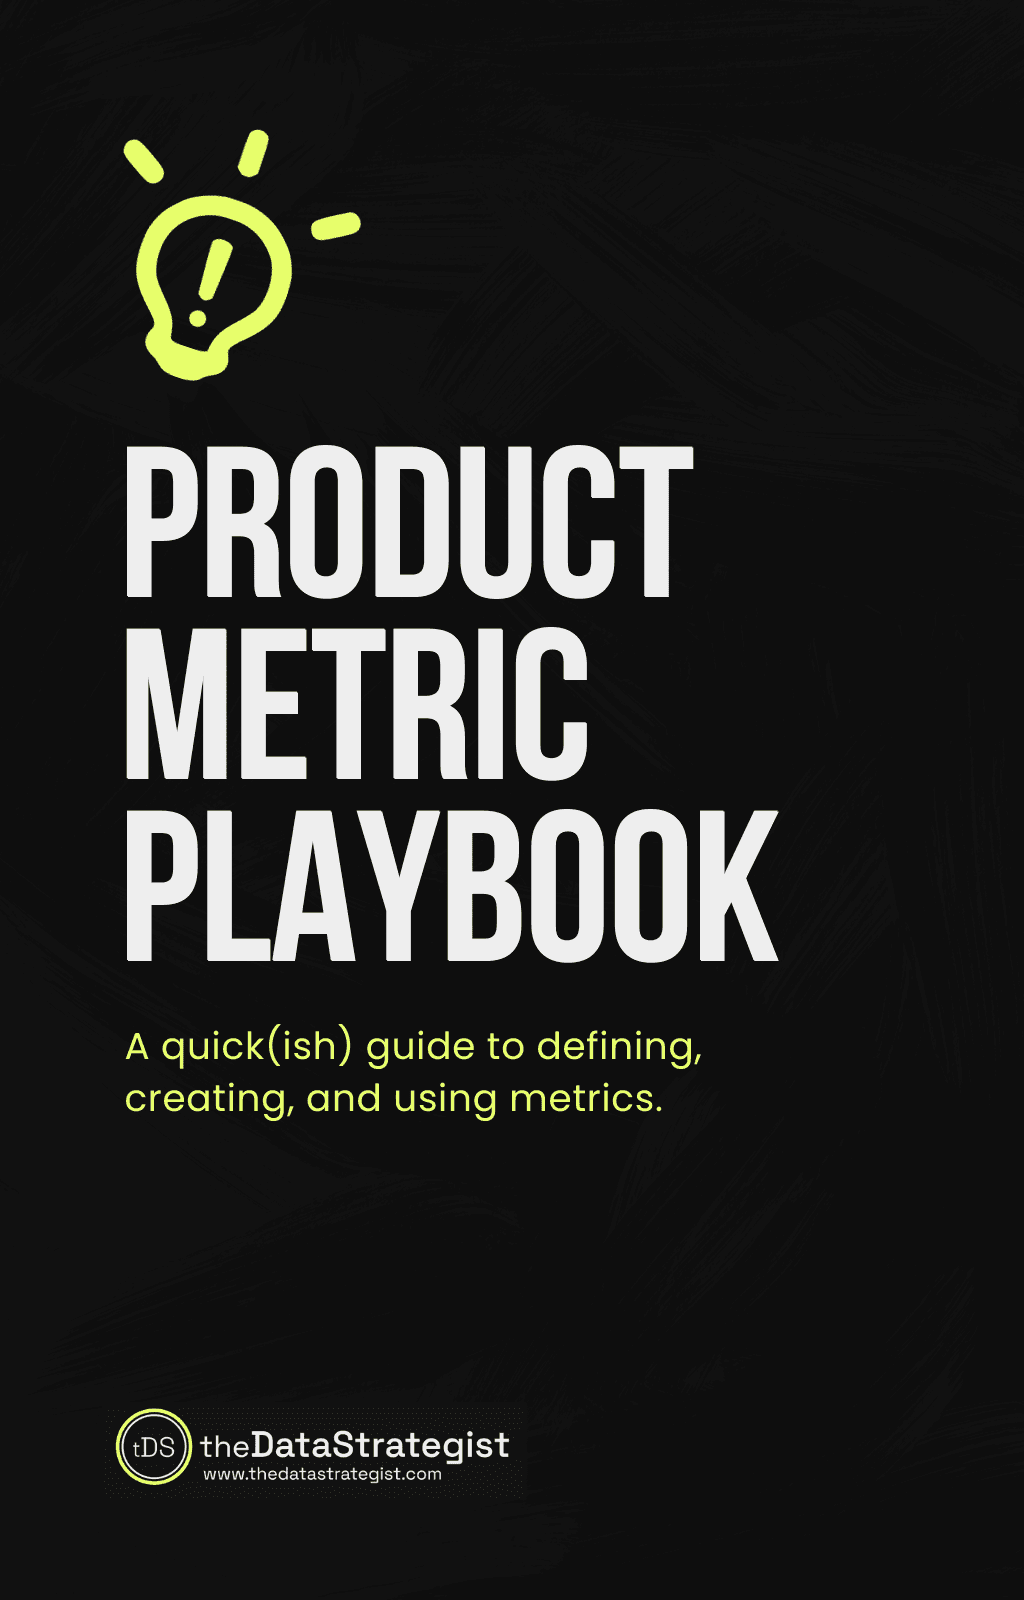
2. Metrics Playbook
We've created a Metrics Playbook to help teams identify the most important metrics in their business.
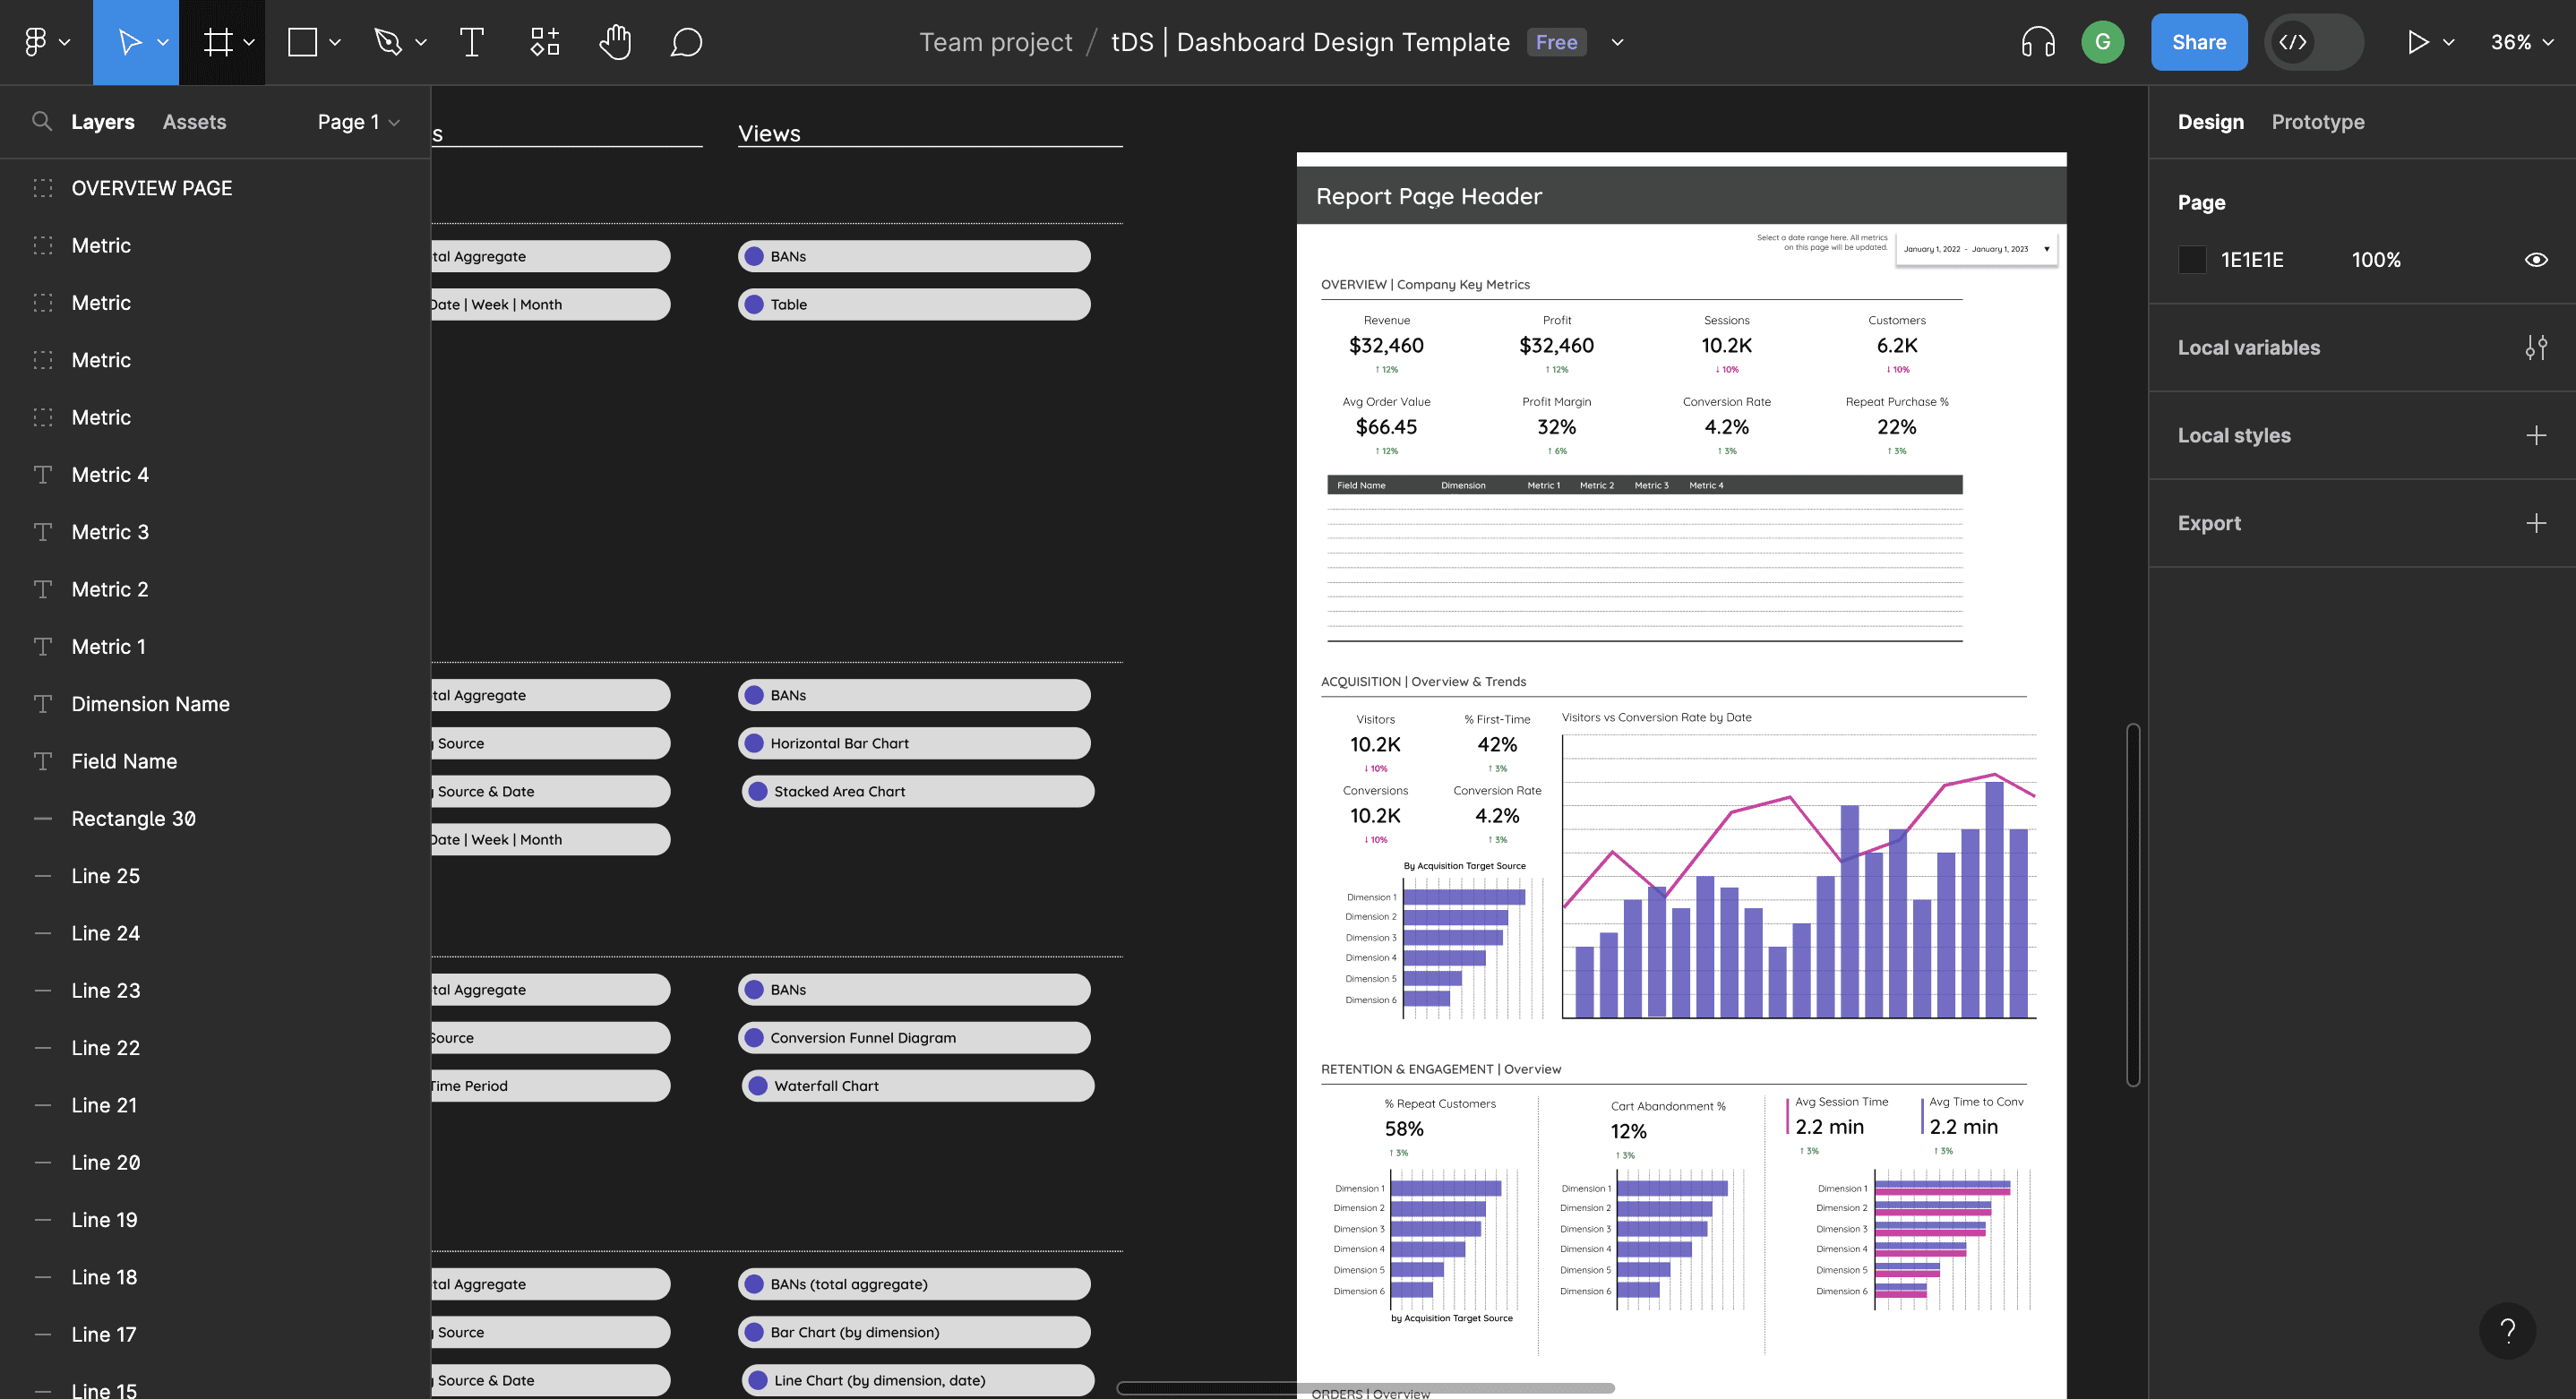
3. Figma Dashboard Design
Before building, we'll identify the datasets, metrics, and views to include in the dashboard. We'll use Figma to design our ideal dashboard.

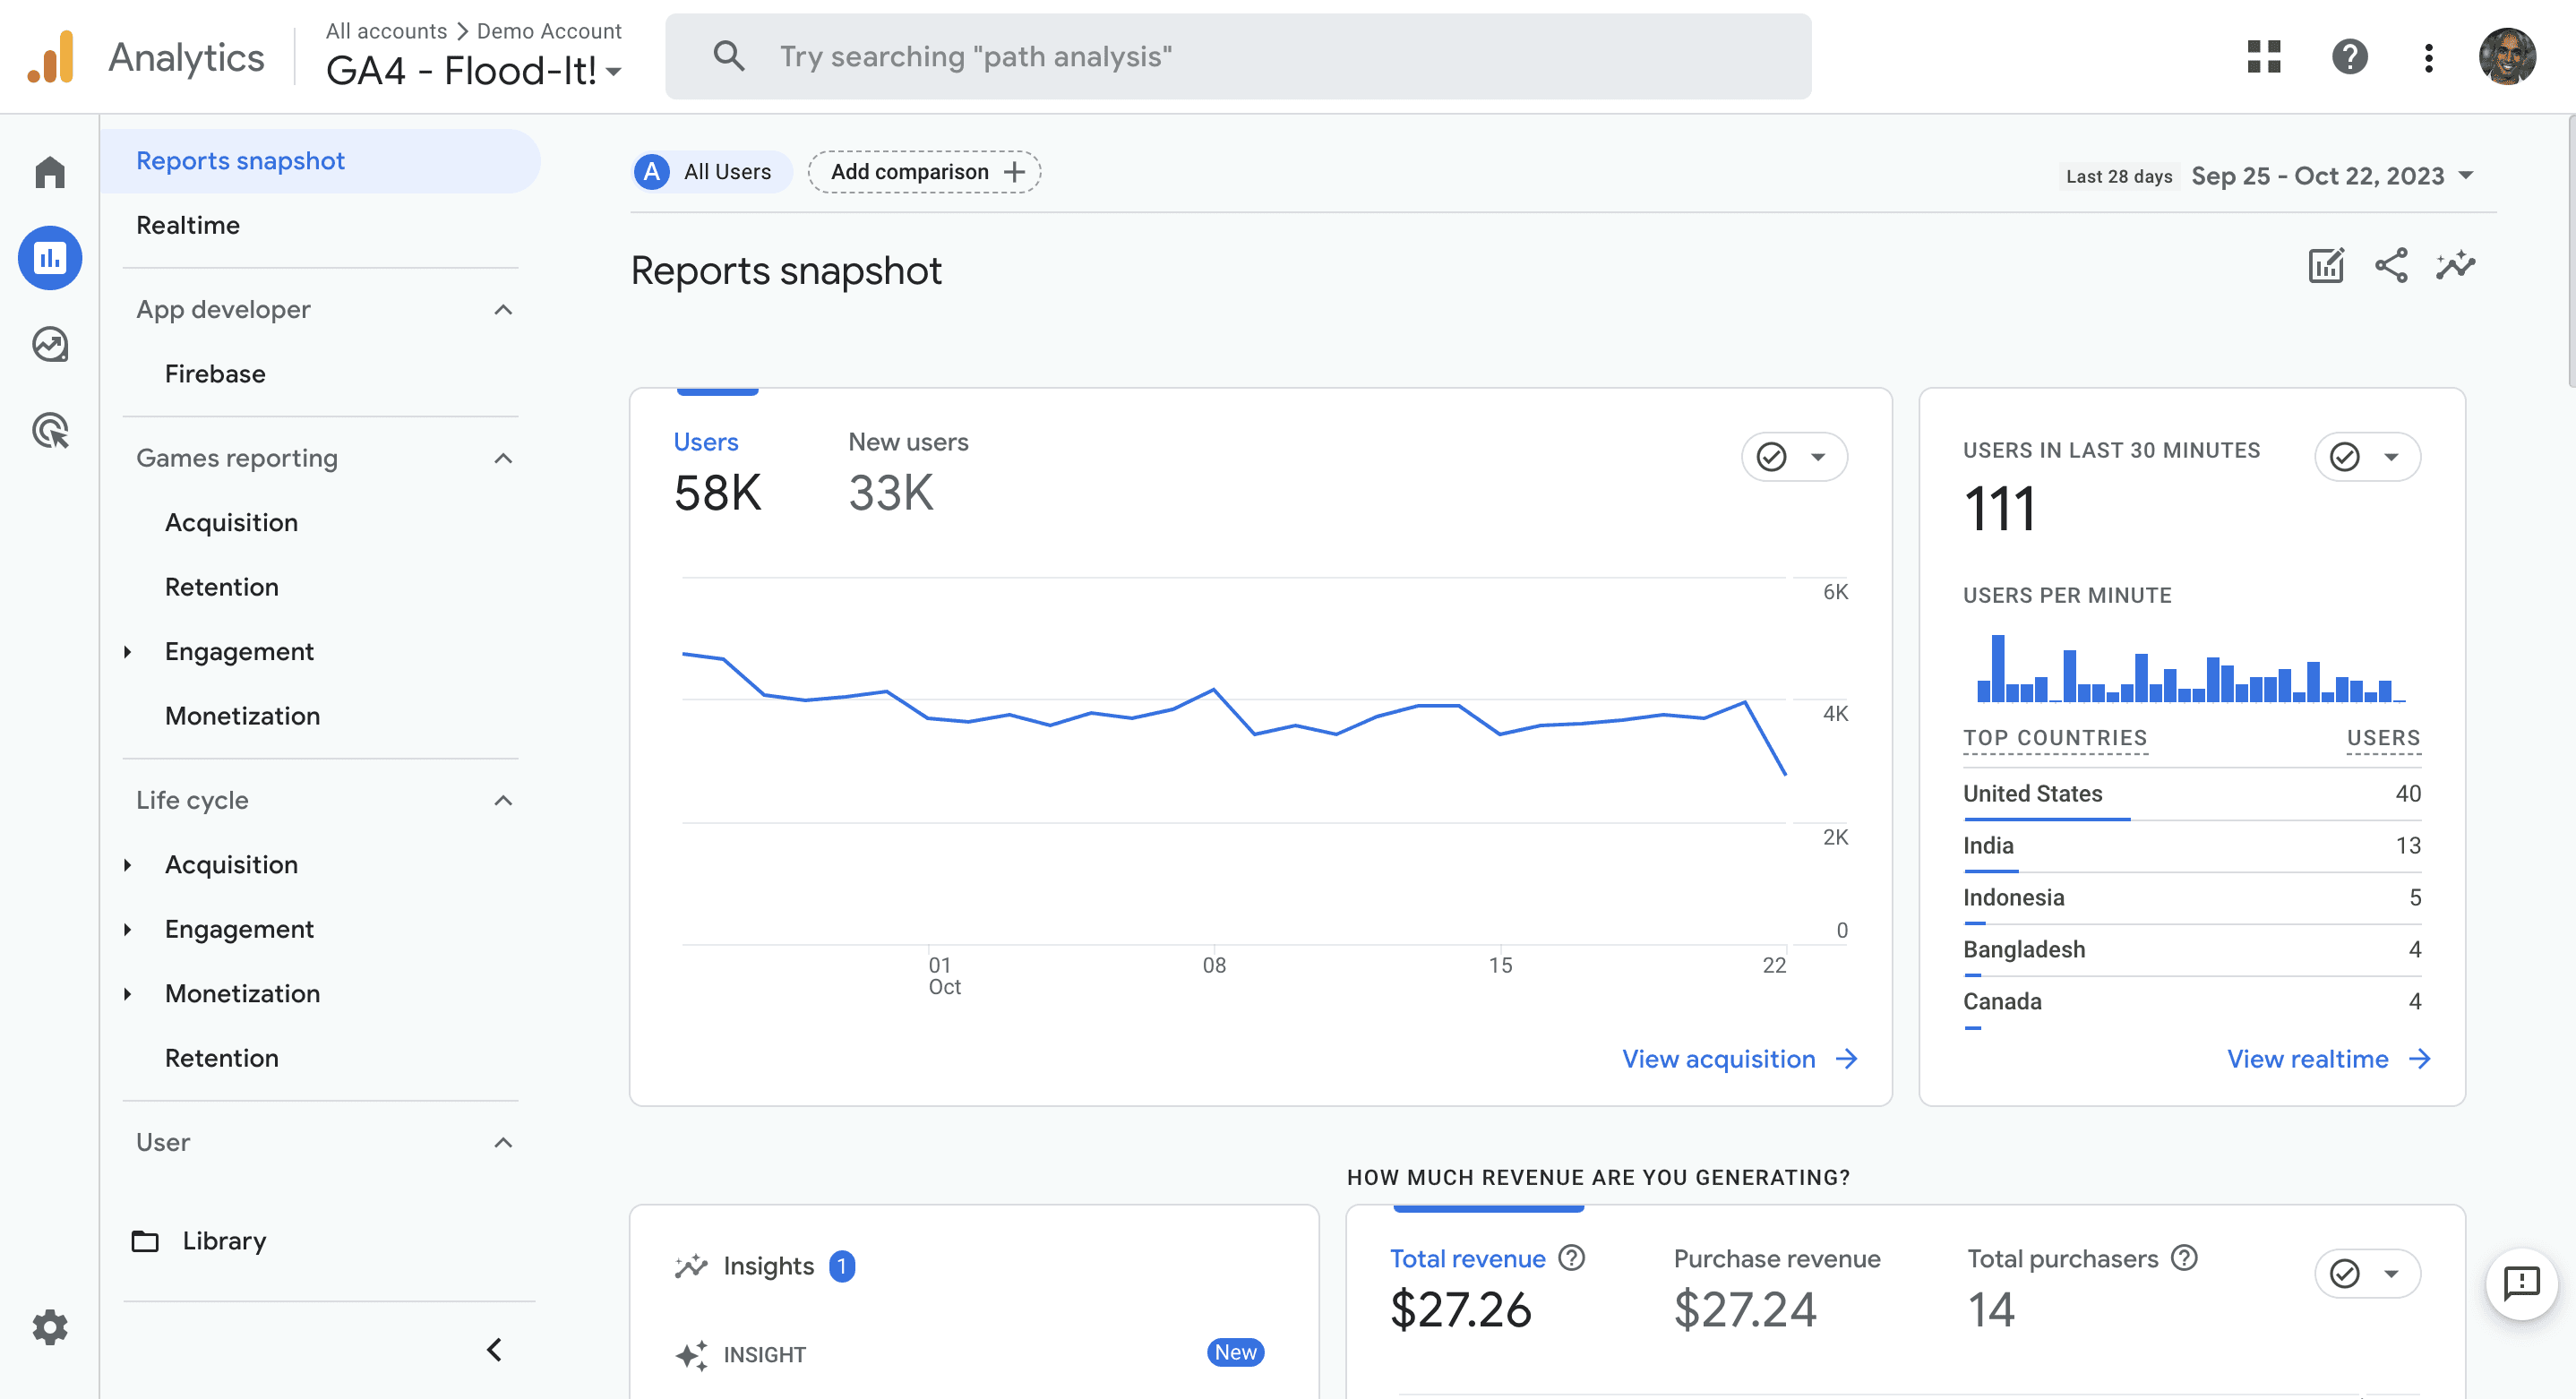
4. GA4 & Shopify Integration
We'll link and configure your Google Analytics, Shopify, and Google Tag Manager accounts.
6. Data Validation
We quality check all of the data we collect and produce, comparing it to Shopify Analytics, GA4, and any existing reporting.
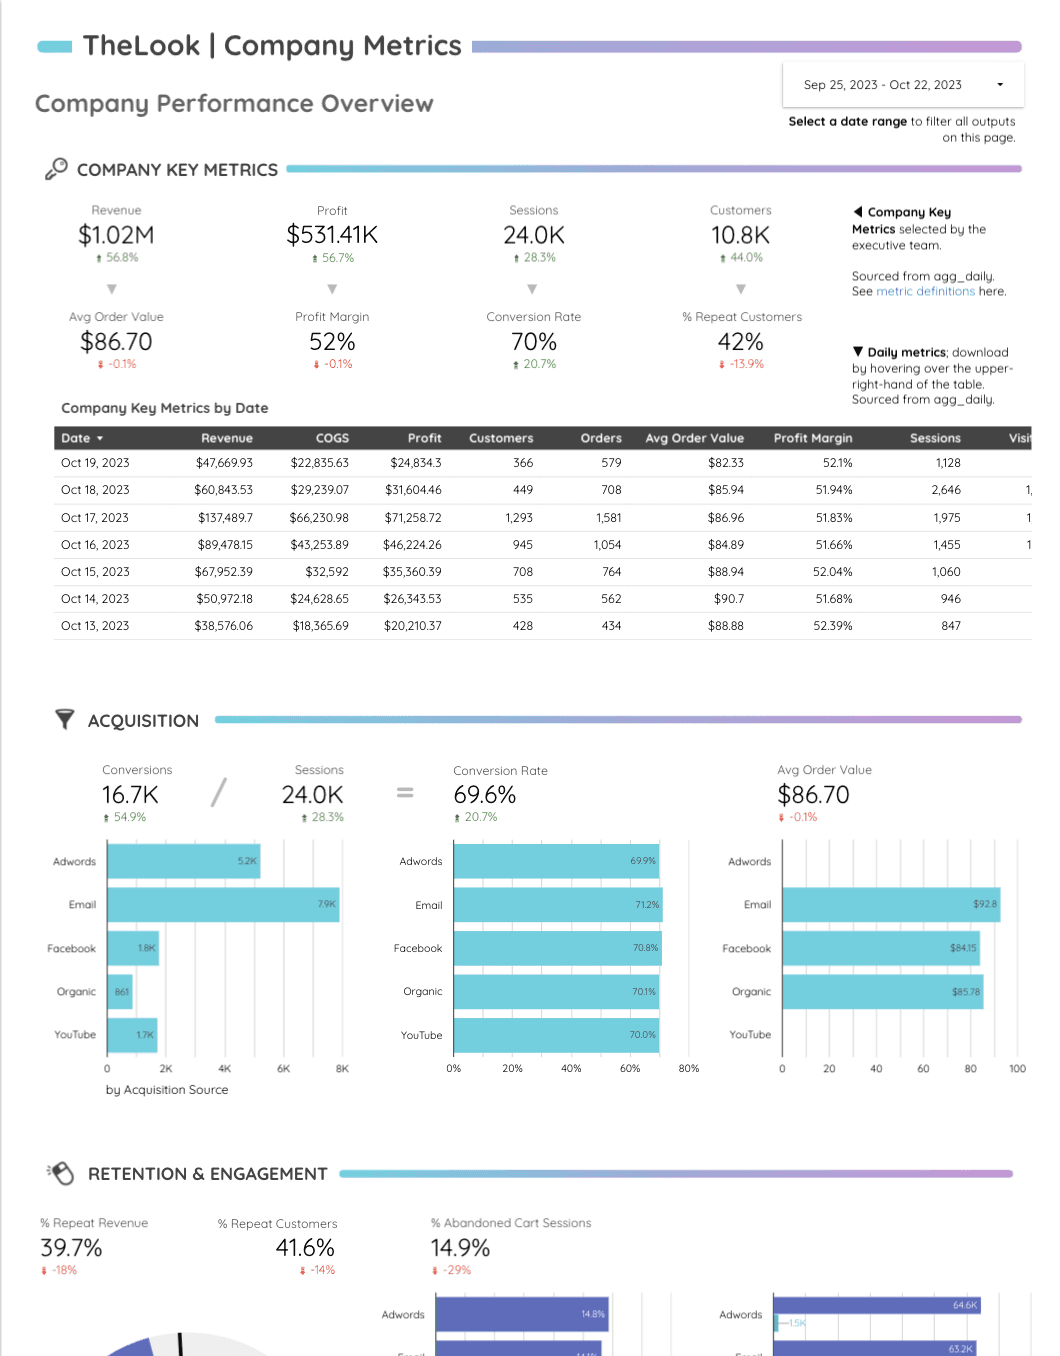
7. Looker Dashboard Build
We use dashboard templates to quickly build a dashboard in Looker. We quickly iterate and tailor the dashboard to your goals from there.
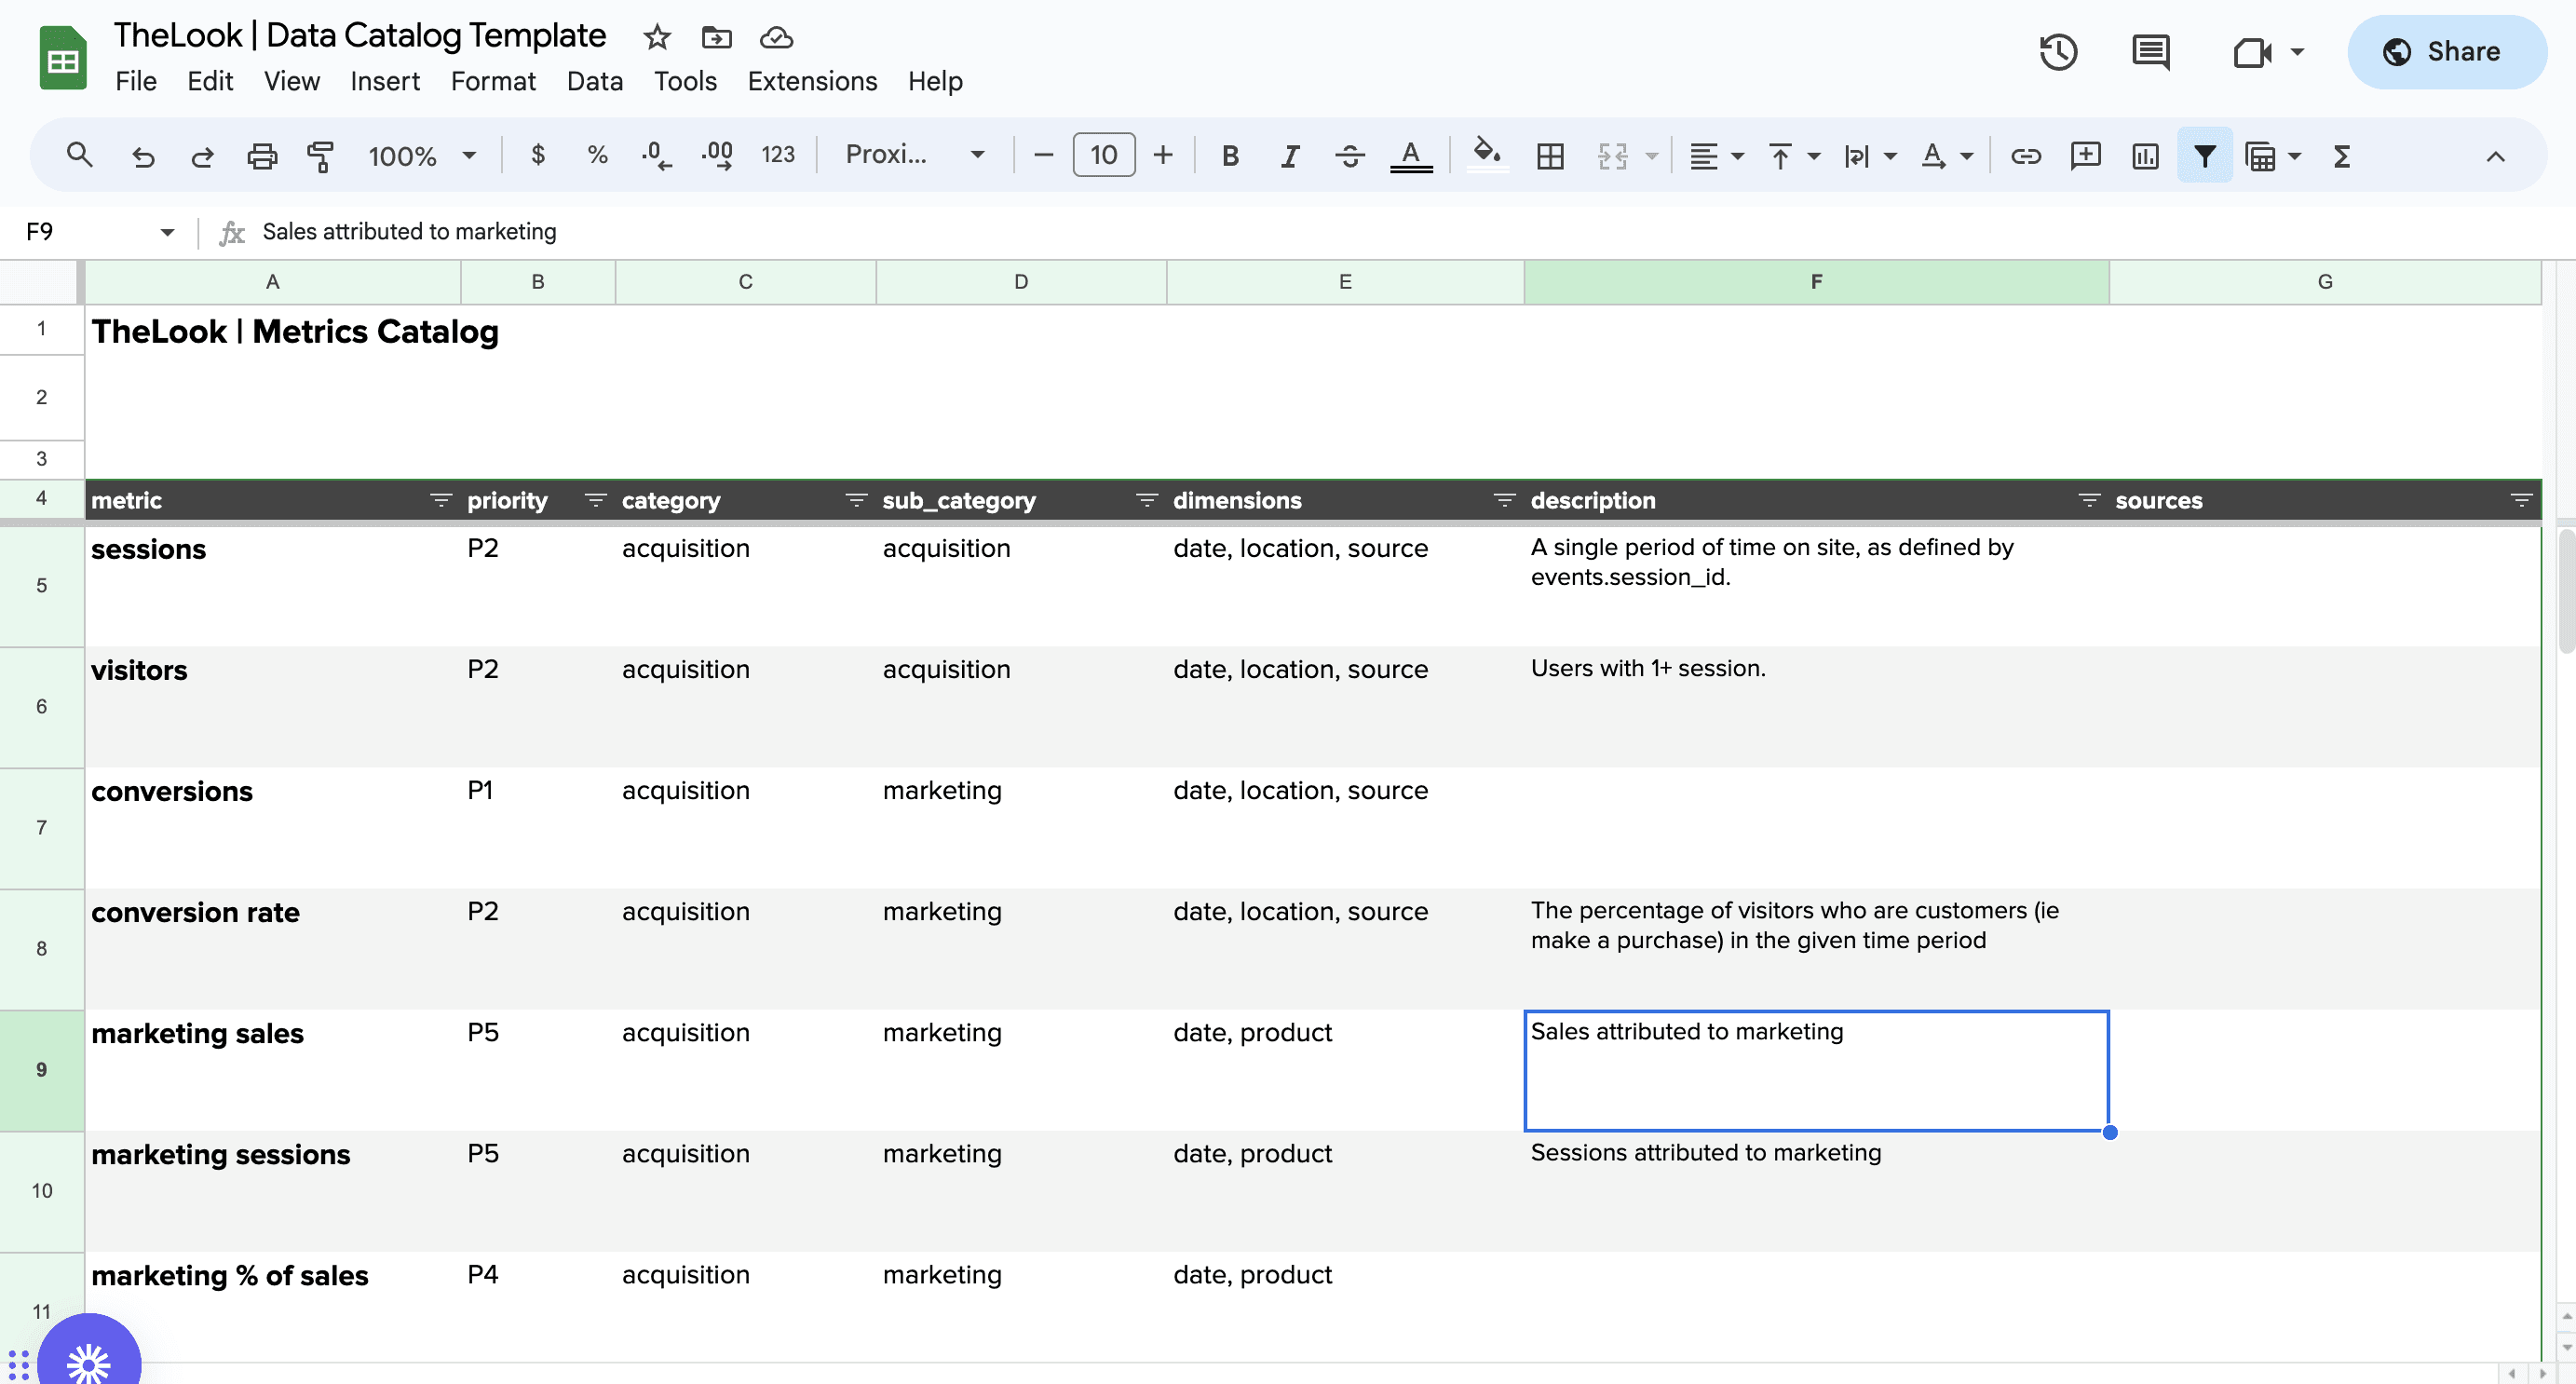
8. Documentation
A key part of this process is documenting the datasets, metrics, and other assets we produce. We've created a Data Catalog to track data assets, metadata, and definitions.

9. Delivery
Throughout the project, we'll provide ongoing updates. At the end, we'll provide a final review of the dashboard and recommend how to leverage it in your business.